Fig. 1
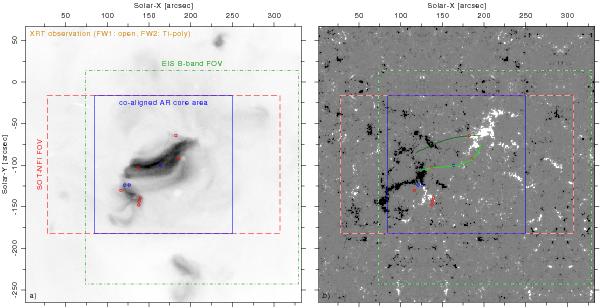
Active region observed by the Hinode satellite on 14 Nov. 2007. The left panel shows the X-ray emission observed by XRT together with the field-of-view of EIS (green dash-dotted square) and SOT-NFI (red dashed rectangle). The right panel displays a line-of-sight magnetogram (saturation level: ±300 G) of the active region that is smoothly embedded in a quiet Sun carpet (see Sect. 3.2). We use only the co-aligned AR core area (blue solid square) for our analyses. The circles and lines indicating various loop structures are co-spatial with those in Fig. 2.
Current usage metrics show cumulative count of Article Views (full-text article views including HTML views, PDF and ePub downloads, according to the available data) and Abstracts Views on Vision4Press platform.
Data correspond to usage on the plateform after 2015. The current usage metrics is available 48-96 hours after online publication and is updated daily on week days.
Initial download of the metrics may take a while.