Fig. 4
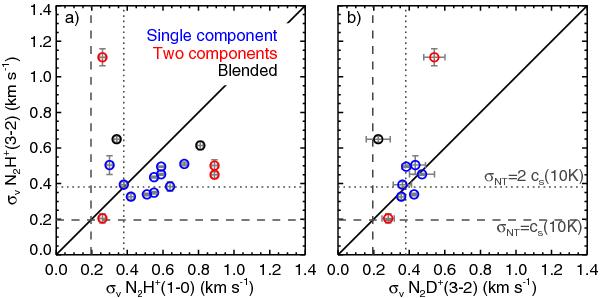
Comparison of the velocity dispersion of different molecular lines. Cores listed as having two components (see Table 3) are shown as red symbols, cores that appear to have blended components are shown in black, and the rest are shown as blue symbols. Dashed and dotted lines show the expected velocity dispersion for the cases where the nonthermal velocity dispersion, σNT, equals cs(10 K) or 2 cs(10 K), where cs(10 K) is the sound speed of the average molecule at 10 K (for a mean molecular weight of μm = 2.33).
Current usage metrics show cumulative count of Article Views (full-text article views including HTML views, PDF and ePub downloads, according to the available data) and Abstracts Views on Vision4Press platform.
Data correspond to usage on the plateform after 2015. The current usage metrics is available 48-96 hours after online publication and is updated daily on week days.
Initial download of the metrics may take a while.