Fig. 9
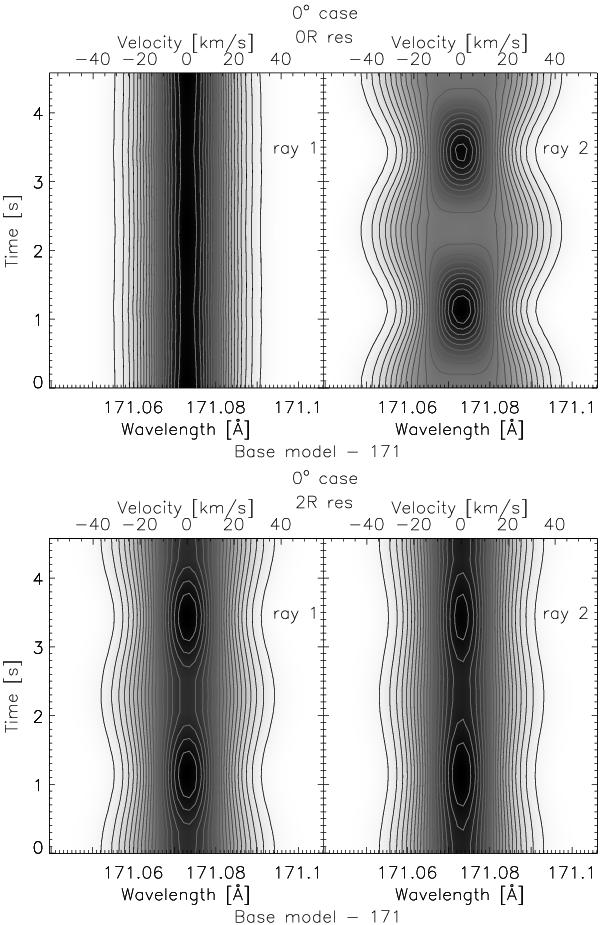
Time variation of the specific intensity Iλ integrated along ray 1 (left panels) and ray 2 (right panels) for the base model − 171 when viewing at an angle of 0° and for a pixel size of 0R (upper panels) and 2R (lower panels). Contours of the intensity are also shown for better visualisation of the variation.
Current usage metrics show cumulative count of Article Views (full-text article views including HTML views, PDF and ePub downloads, according to the available data) and Abstracts Views on Vision4Press platform.
Data correspond to usage on the plateform after 2015. The current usage metrics is available 48-96 hours after online publication and is updated daily on week days.
Initial download of the metrics may take a while.