Fig. 6
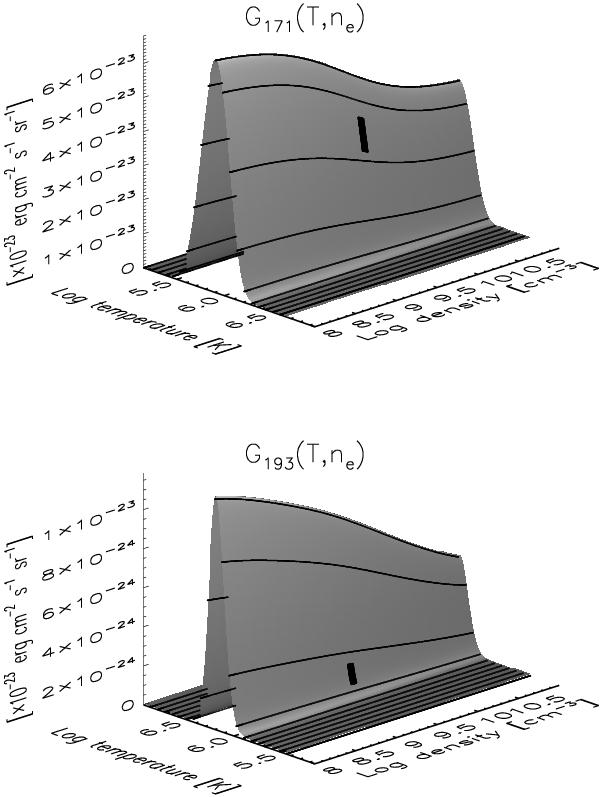
Contribution function Gλ0(T,ne) for Fe ix 171 and Fe xii 193. The maximum formation temperature for these ions are, respectively, log T = 5.9 and log T = 6.2 K. The black parallelogram in each surface has its corners defined by the minimum and maximum temperature and density values found in the base model, and therefore includes the Gλ0(T,ne) values used here. The temperature range in the upper panel has been inverted in order to show the parallelogram for the G171(T,ne) surface.
Current usage metrics show cumulative count of Article Views (full-text article views including HTML views, PDF and ePub downloads, according to the available data) and Abstracts Views on Vision4Press platform.
Data correspond to usage on the plateform after 2015. The current usage metrics is available 48-96 hours after online publication and is updated daily on week days.
Initial download of the metrics may take a while.