Fig. 5
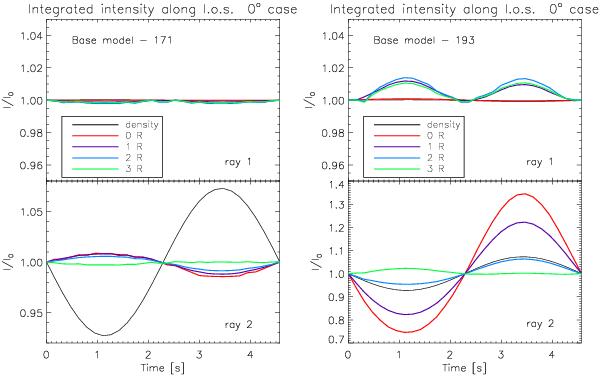
Integrated intensity along the line-of-sight (normalised with respect to the equilibrium value) for the 0° angle case for the base model − 171 (left panels) and the base model − 193 (right panels) for two specific rays: ray 1 crossing a node (top most panels) and ray 2 crossing an anti-node (bottom panels), shown with crosses in Figs. 3 and 4. Different colours denote different pixel sizes: 0R,1R,2R, and 3R in red, purple, blue, and green, respectively, where R = 1 Mm ≈ ℓ denotes the radius of the cylinder and 0R denotes the spatial resolution in the high resolution model: 2.5 km. The black curve denotes the density profile at the centre of the cylinder and the same location along the axis of the cylinder as rays 1 and 2. The intensity range of the top panels is set significantly narrower than that of the bottom panels in order to show the low intensity modulation at the nodes.
Current usage metrics show cumulative count of Article Views (full-text article views including HTML views, PDF and ePub downloads, according to the available data) and Abstracts Views on Vision4Press platform.
Data correspond to usage on the plateform after 2015. The current usage metrics is available 48-96 hours after online publication and is updated daily on week days.
Initial download of the metrics may take a while.