Fig. 15
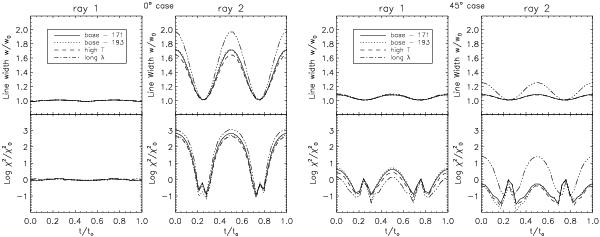
Model comparison of the temporal variation of the spectral line broadening. The line width (upper panels) and (logarithm of) the non-Gaussianity χ2 parameter (lower panels) resulting from the Gaussian fits to the specific intensity Iλ(t) for the 0R pixel size case are presented. From left to right the first two panels correspond to rays 1 and 2 for the 0° angle case. The last two panels correspond to rays 1 and 2 for the 45° angle case. Different line styles denote the different models studied in this work, as indicated in the legend. The normalisation values are the time averages of the corresponding quantities for ray 1 and 0° viewing angle.
Current usage metrics show cumulative count of Article Views (full-text article views including HTML views, PDF and ePub downloads, according to the available data) and Abstracts Views on Vision4Press platform.
Data correspond to usage on the plateform after 2015. The current usage metrics is available 48-96 hours after online publication and is updated daily on week days.
Initial download of the metrics may take a while.