Fig. 14
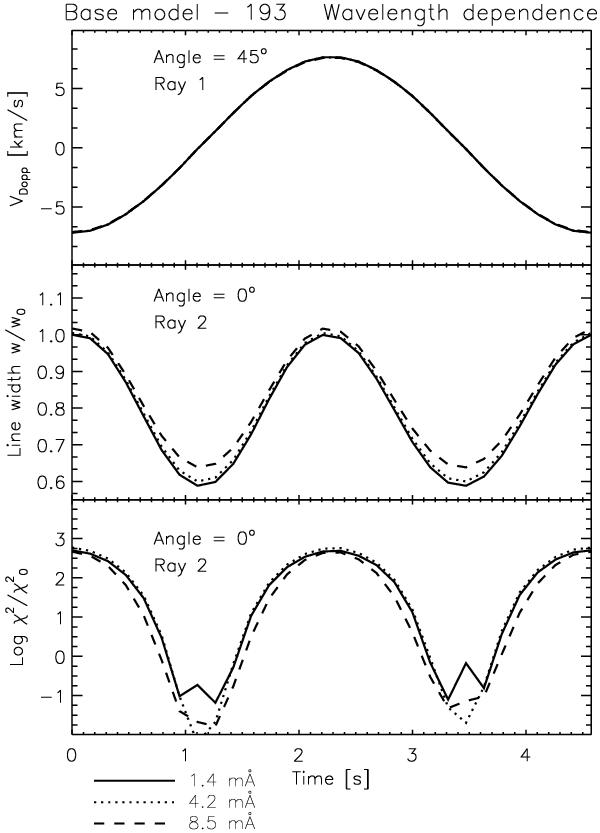
Temporal evolution of the Doppler velocity (upper panel), the line width (centre panel) and (logarithm of) the χ2 non-Gaussianity parameter (lower panel) resulting from Gaussian fits to the specific intensity profile Iλ(t) obtained from the base model − 193, for different wavelength resolutions. We consider samplings of 1.4 mÅ (solid curve), 4.2 mÅ (dotted curve) and 8.5 mÅ, leading to 48, 16 and 8 points along the spectral line, respectively. In order to show best the effects of the wavelength we fix the pixel size resolution to 0R and show the case of ray 1 with a viewing angle of 45° for the top panel and the case of ray 2 with a viewing angle of 0° for the middle and bottom panels. The normalisation values are the same as in Fig. 13.
Current usage metrics show cumulative count of Article Views (full-text article views including HTML views, PDF and ePub downloads, according to the available data) and Abstracts Views on Vision4Press platform.
Data correspond to usage on the plateform after 2015. The current usage metrics is available 48-96 hours after online publication and is updated daily on week days.
Initial download of the metrics may take a while.