Fig. 13
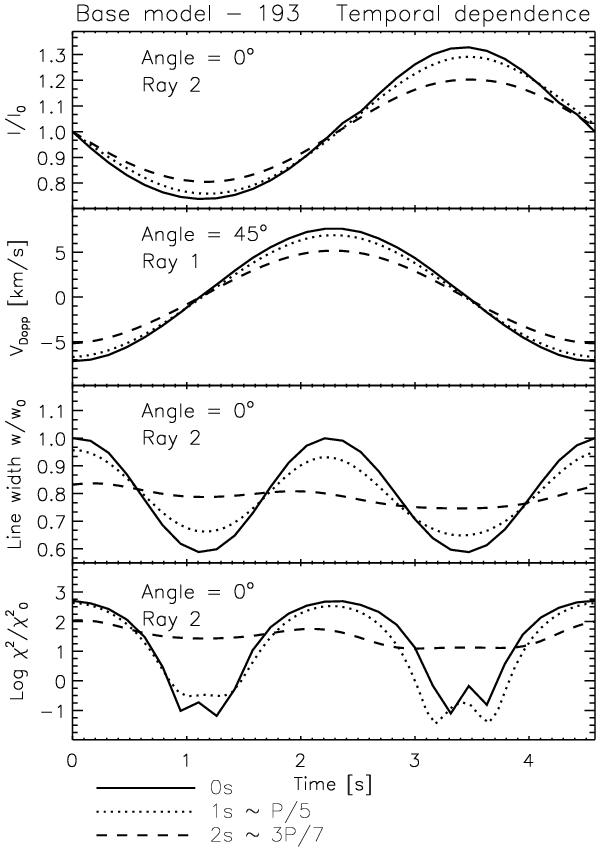
Effects of the temporal resolution on the modulation of observable quantities. We take the base model − 193, fix the pixel size resolution to 0R and consider cadences of “0s” (=0.15 s, solid curve), “1s” (=1 s) ≃P/5 (dotted curve), and “2s” (=2 s) ≃ 3P/7 (dashed curve), where P ≃ 4.5 s is the period of the mode. The upper panel shows the temporal evolution of the normalised integrated intensity along the line-of-sight for ray 2 taking a viewing angle of 0°. The rest of the panels, respectively from top to bottom, show the temporal evolution of the Doppler velocity, the line width and (logarithm of) the χ2 non-Gaussianity parameter resulting from Gaussian fits to the specific intensity profile Iλ(t) for the different temporal resolutions. In order to show best the effects on the Doppler velocity, only for this quantity we take the case of ray 1 with a viewing angle of 45°. The normalisation factor for the line width is the initial value at time t = 0 for the 0s temporal resolution. That of the χ2 parameter is the time average value of the profile for ray 1 for 0s temporal resolution.
Current usage metrics show cumulative count of Article Views (full-text article views including HTML views, PDF and ePub downloads, according to the available data) and Abstracts Views on Vision4Press platform.
Data correspond to usage on the plateform after 2015. The current usage metrics is available 48-96 hours after online publication and is updated daily on week days.
Initial download of the metrics may take a while.