Fig. 11
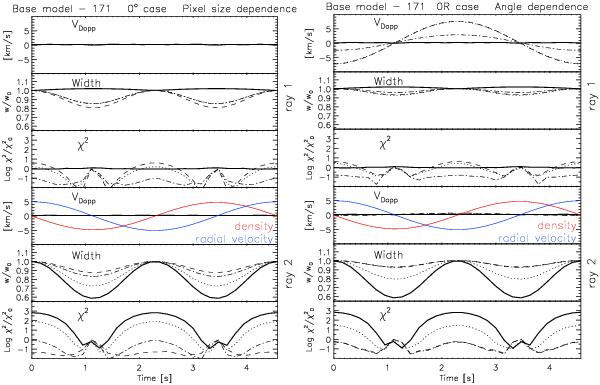
Left panel: pixel size resolution dependence of the time variation of the specific intensity Iλ for the 0° angle case of the base model − 171. From top to bottom we show quantities ensuing from a Gaussian fit to the spectral line. The first 3 upper panels correspond to the Doppler velocity, the line width and the goodness-of-fit χ2 parameter for the case of ray 1 (node). The 3 lower panels show the same quantities for the case of ray 2 (anti-node). Different line styles correspond to different pixel size resolution: 0R (solid), 1R (dotted), 2R (dashed), 3R (dot-dashed). The line width is normalised with respect to the initial value at time t = 0. The unit for the χ2 parameter is the logarithm of the normalised value, where the normalisation factor is the equilibrium value. Right panel: angle dependence of the time variation of the specific intensity Iλ for the 0R pixel size case of the base model − 171. The arrangement of these panels is the same as for the left panels. Different line styles denote different line-of-sight angles: 0° (solid), 30° (dotted), 45° (dashed), 60° (dot-dashed). For both left and right panels the variation in time of density (red curve) and radial velocity (blue curve) at the centre of the tube is plotted for reference in arbitrary units in the Doppler velocity panel.
Current usage metrics show cumulative count of Article Views (full-text article views including HTML views, PDF and ePub downloads, according to the available data) and Abstracts Views on Vision4Press platform.
Data correspond to usage on the plateform after 2015. The current usage metrics is available 48-96 hours after online publication and is updated daily on week days.
Initial download of the metrics may take a while.