Fig. 2
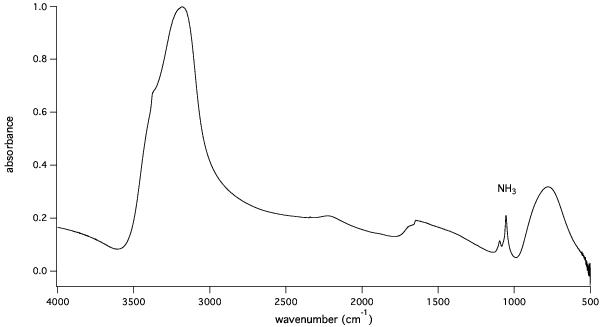
Infrared spectrum of a NH3:ASW bilayer film at 15 K. The quantity of deposited NH3 and H2O are derived from their characteristic absorption bands. The diffusion of NH3 along the x direction at a fixed temperature T will be monitored by recording the decay of its characteristic absorption band at 1110 cm-1 as a function of time.
Current usage metrics show cumulative count of Article Views (full-text article views including HTML views, PDF and ePub downloads, according to the available data) and Abstracts Views on Vision4Press platform.
Data correspond to usage on the plateform after 2015. The current usage metrics is available 48-96 hours after online publication and is updated daily on week days.
Initial download of the metrics may take a while.