Fig. 4
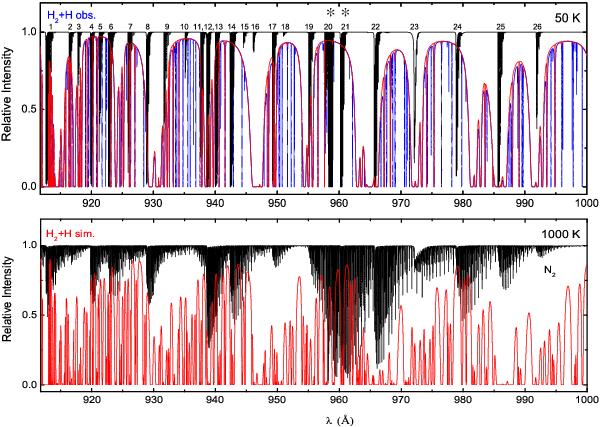
Simulated absorption spectra for N2 (black) and H2 + H (red) in the wavelength range 912–1000 Å assuming thermal excitation temperatures of 50 (top) and 1000 K (bottom). The column density of N2 is 1015 cm-2 and values for H2 and H are taken to be half of the observed column densities in the well-studied diffuse cloud toward ζ Oph, as is appropriate for the center of the cloud: N(H2) = 2.1 × 10²⁰ and N(H) = 2.6 × 1020 cm-2. The model H2 Doppler width is 3 km s-1. Also shown is the H2 + H absorption spectrum (blue) toward ζ Oph using the observed column densities for individual J levels, showing enhanced non-thermal excitation of H2 in the higher J levels. The asterisks indicate the c′(0) (Band 20) and c(0) (Band 21) bands, respectively, detected in absorption toward HD 124314.
Current usage metrics show cumulative count of Article Views (full-text article views including HTML views, PDF and ePub downloads, according to the available data) and Abstracts Views on Vision4Press platform.
Data correspond to usage on the plateform after 2015. The current usage metrics is available 48-96 hours after online publication and is updated daily on week days.
Initial download of the metrics may take a while.