Fig. 10
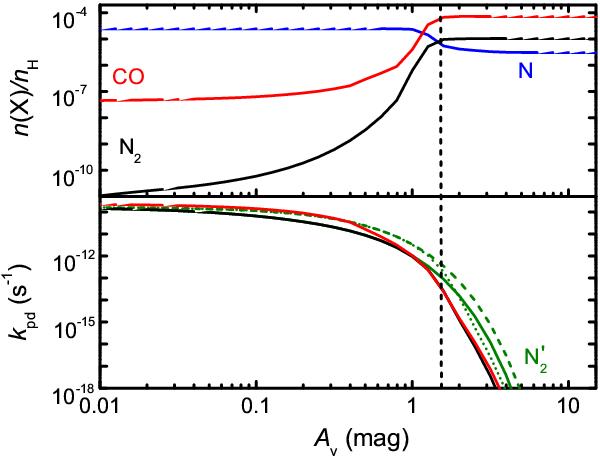
Top: relative abundances of N, N2 and CO as a function of depth into a translucent cloud with χ = 1, T = 30 K and nH = 103 cm-3. Bottom: photodissociation rates of N2 (black) and CO (red) as functions of depth. Alternative photodissociation rate curves (, green) consider shielding by dust alone (dashed), dust + self-shielding (dotted), and dust + H + H2 (solid). The conversion from N to N2 occurs at AV ≃ 1.5 mag, as shown by the vertical dashed line.
Current usage metrics show cumulative count of Article Views (full-text article views including HTML views, PDF and ePub downloads, according to the available data) and Abstracts Views on Vision4Press platform.
Data correspond to usage on the plateform after 2015. The current usage metrics is available 48-96 hours after online publication and is updated daily on week days.
Initial download of the metrics may take a while.