Fig. 2
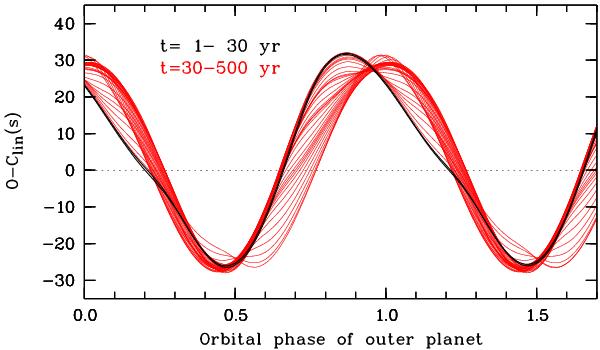
Temporal variation of the mid-eclipse times of NN Ser as predicted by our best-fitting dynamical two-planet model of Table 2 relative to the underlying linear ephemeris of the binary and folded over the orbital period of the outer planet. The first two orbits, covering a time interval of 30 yr (black curves), and the next 29 orbits (30–500 yr, red curves) are displayed.
Current usage metrics show cumulative count of Article Views (full-text article views including HTML views, PDF and ePub downloads, according to the available data) and Abstracts Views on Vision4Press platform.
Data correspond to usage on the plateform after 2015. The current usage metrics is available 48-96 hours after online publication and is updated daily on week days.
Initial download of the metrics may take a while.