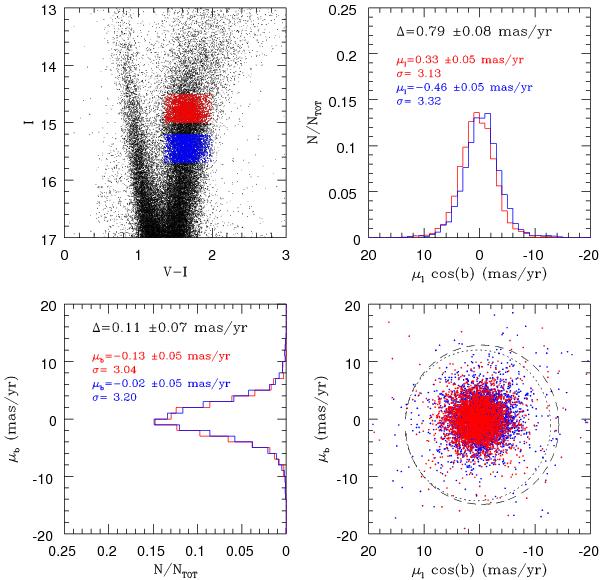
Fig. 5
PM measured at (l,b) = (0, −6) field for bulge RC stars. The blue and red dots identify the selected BRC and FRC stars on the CMD, respectively. A 3σ selection (lower right panel) in the μlcos (b) and μb plane is used to define the sample further analyzed with histograms. The lower left panel shows μb distribution, while the upper right panel compares μlcos (b) distributions for the BRC and FRC stars. The mean values of μlcos (b) and μb for the BRC and FRC samples are given in the respective panels showing the distributions, and we also provide the mean differences in proper motion for the two RC populations.
Current usage metrics show cumulative count of Article Views (full-text article views including HTML views, PDF and ePub downloads, according to the available data) and Abstracts Views on Vision4Press platform.
Data correspond to usage on the plateform after 2015. The current usage metrics is available 48-96 hours after online publication and is updated daily on week days.
Initial download of the metrics may take a while.