Fig. B.1
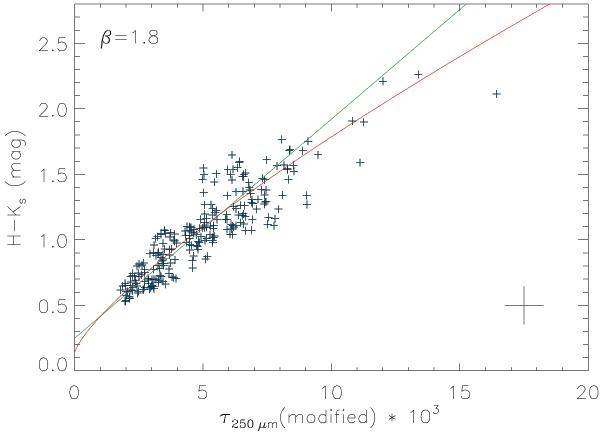
H − K colours of stars in the background of CrA C
as a function of a modified τ250 μm
where we have attempted to correct for the effect of line-of-sight temperature
variations. It is assumed that the relationship between the observed and “true”
optical depth is similar to the model shown in Fig. A.1. The red curve shows the relationship expected from the result of
Roy et al. (2013) where the
σH increases as
 and
the green line is a linear fit to the data points. The mean error of the data points
is indicated with a cross in the bottom right.
and
the green line is a linear fit to the data points. The mean error of the data points
is indicated with a cross in the bottom right.
Current usage metrics show cumulative count of Article Views (full-text article views including HTML views, PDF and ePub downloads, according to the available data) and Abstracts Views on Vision4Press platform.
Data correspond to usage on the plateform after 2015. The current usage metrics is available 48-96 hours after online publication and is updated daily on week days.
Initial download of the metrics may take a while.