Fig. 4
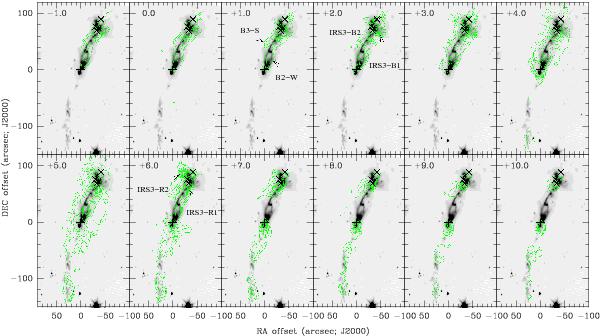
CO (6−5) low-velocity channel maps in L1448-mm/IRS3 region. Contours spacing is 2σ, with the first contour at 3σ (σ = 0.62 K km s-1). The plus symbol and crosses represent the continuum sources as in Fig. 3. The arrows indicate the clumps that are traced only at low velocities (positions reported in Table 3).
Current usage metrics show cumulative count of Article Views (full-text article views including HTML views, PDF and ePub downloads, according to the available data) and Abstracts Views on Vision4Press platform.
Data correspond to usage on the plateform after 2015. The current usage metrics is available 48-96 hours after online publication and is updated daily on week days.
Initial download of the metrics may take a while.