Fig. 7
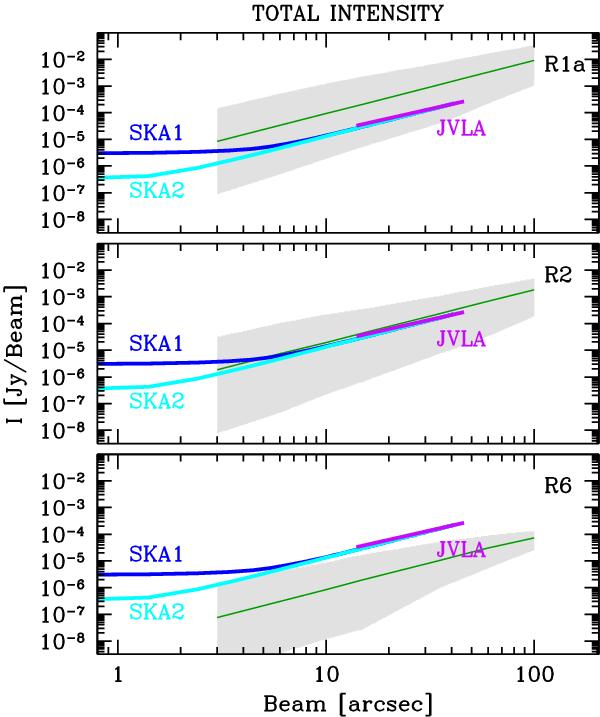
Total intensity surface brightness as a function of the beam size (3″–100″) for the mock radio halos R1a (top), R2 (middle), and R6 (bottom). For each radio halo, the surface brightness is calculated within a circle of 3re in radius. The solid thin green line shows the average brightness, while the shaded region shows the maximum and minimum brightness fluctuations. The simulated surface brightness is compared with the sensitivity of wide band instruments (SKA Phase-1, SKA Phase-2, JVLA) to explore their potential in detecting the total intensity emission of halos at different radio power. The sensitivity refers to the 3-σ limit.
Current usage metrics show cumulative count of Article Views (full-text article views including HTML views, PDF and ePub downloads, according to the available data) and Abstracts Views on Vision4Press platform.
Data correspond to usage on the plateform after 2015. The current usage metrics is available 48-96 hours after online publication and is updated daily on week days.
Initial download of the metrics may take a while.