Fig. 2
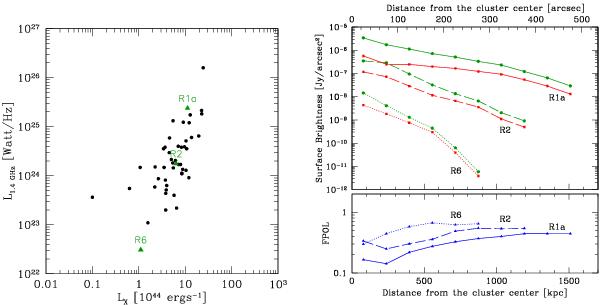
Left: radio power at 1.4 GHz versus the cluster X-ray luminosity in the 0.1−2.4 keV band. Full dots are observed clusters taken from the recent compilations by Feretti et al. (2012) and Govoni et al. (2012); green triangles are the simulated clusters R1a, R2, and R6 from Xu et al. (2012). In these simulations LX and L1.4 GHz have been calculated within a circle of 1 Mpc in radius. Right: azimuthally averaged radio-halo brightness profiles of the total intensity I (green dots), polarized intensity P (red squares), and fractional polarization FPOL = (blue triangles) of the clusters R1a (solid lines), R2 (dashed lines), and R6 (dotted lines).
Current usage metrics show cumulative count of Article Views (full-text article views including HTML views, PDF and ePub downloads, according to the available data) and Abstracts Views on Vision4Press platform.
Data correspond to usage on the plateform after 2015. The current usage metrics is available 48-96 hours after online publication and is updated daily on week days.
Initial download of the metrics may take a while.