Fig. 1
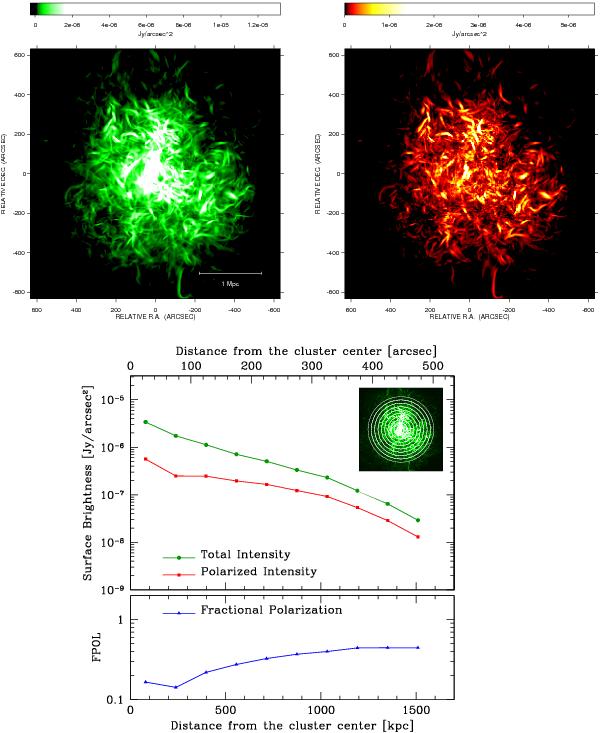
Example of full resolution (10.7 kpc/pixel) radio halo in the simulated galaxy cluster R1a. Left and right panels refer to the total intensity and polarized surface brightness images, respectively. The bottom panels show the azimuthally averaged radio-halo brightness profiles of the total intensity I (green dots), polarized intensity P (red squares), and fractional polarization FPOL (blue triangles). The profiles have been calculated in concentric annuli, as shown in the inset panel.
Current usage metrics show cumulative count of Article Views (full-text article views including HTML views, PDF and ePub downloads, according to the available data) and Abstracts Views on Vision4Press platform.
Data correspond to usage on the plateform after 2015. The current usage metrics is available 48-96 hours after online publication and is updated daily on week days.
Initial download of the metrics may take a while.