Fig. 5
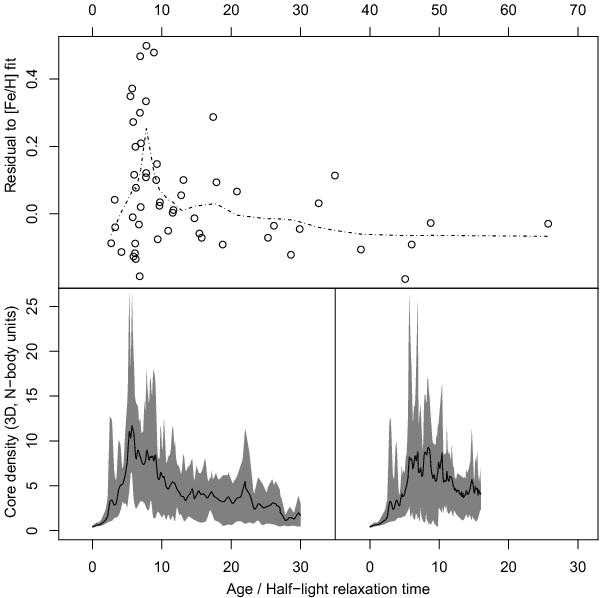
Top panel: residuals to the metallicity fit associated to each GC, as in Fig. 3. Bottom panel, left: core mass-density in our set of direct N-body simulations of GCs (see Table 1) as a function of dynamical age. The gray shaded area is the envelope encompassing all simulations. The black solid line is the global average. The dynamical age was computed using the initial half-mass relaxation time (prescription (a) in the text). Bottom panel, right: same as left panel, but half-mass relaxation time was recomputed for each snapshot based on Binney & Tremaine (1987) definition (prescription (b) in the text). In both cases density peaks between 5 and 10 initial half-mass relaxation times. Upper and lower panels all share the same horizontal axis, but in the upper panel the abscissa values extend more, so we put axis labels on its upper side for improved readability.
Current usage metrics show cumulative count of Article Views (full-text article views including HTML views, PDF and ePub downloads, according to the available data) and Abstracts Views on Vision4Press platform.
Data correspond to usage on the plateform after 2015. The current usage metrics is available 48-96 hours after online publication and is updated daily on week days.
Initial download of the metrics may take a while.