Free Access
Fig. 8
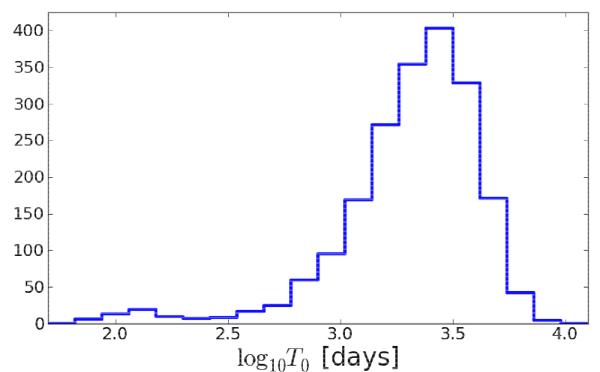
Distribution of best-fit sinusoidal periods for those 1 724 QSO lightcurves that are best described by a combination of sinusoid and OU process. We quote rest-frame periods that have been corrected for redshift.
Current usage metrics show cumulative count of Article Views (full-text article views including HTML views, PDF and ePub downloads, according to the available data) and Abstracts Views on Vision4Press platform.
Data correspond to usage on the plateform after 2015. The current usage metrics is available 48-96 hours after online publication and is updated daily on week days.
Initial download of the metrics may take a while.