Fig. 6
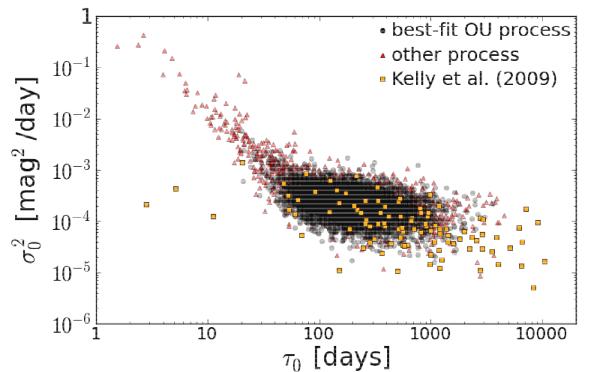
Maximum-likelihood rest-frame parameters τ0 and
 of the
OU process for all 6304 Stripe 82 QSO lightcurves. Black dots represent QSO
lightcurves that are best described by an OU process, whereas red triangles
represent those where the OU process is not the best description.
Orange squares represent 100 MACHO QSO lightcurves from Kelly et al. (2009).
of the
OU process for all 6304 Stripe 82 QSO lightcurves. Black dots represent QSO
lightcurves that are best described by an OU process, whereas red triangles
represent those where the OU process is not the best description.
Orange squares represent 100 MACHO QSO lightcurves from Kelly et al. (2009).
Current usage metrics show cumulative count of Article Views (full-text article views including HTML views, PDF and ePub downloads, according to the available data) and Abstracts Views on Vision4Press platform.
Data correspond to usage on the plateform after 2015. The current usage metrics is available 48-96 hours after online publication and is updated daily on week days.
Initial download of the metrics may take a while.