Fig. 4
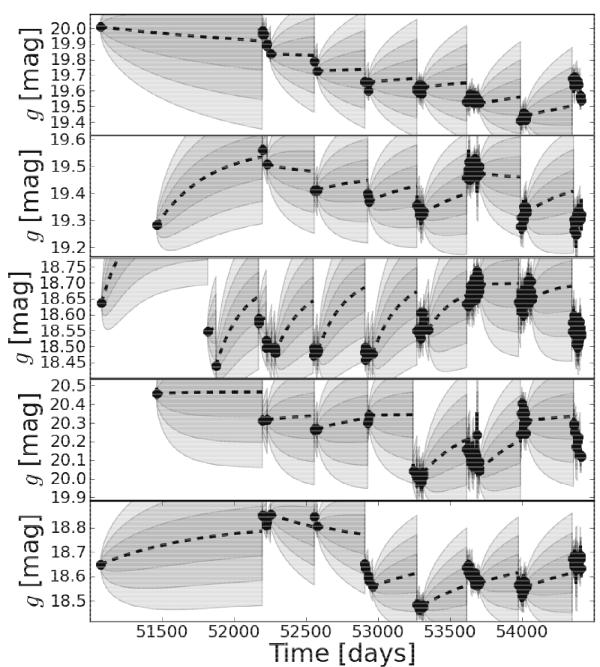
Five randomly selected example lightcurves where the OU process has highest evidence of all models. The best-fit model prediction is probabilistic. The black dashed line is the time-evolution of the mean. The three different grey shadings are the 1, 2, and 3σ intervals, respectively.
Current usage metrics show cumulative count of Article Views (full-text article views including HTML views, PDF and ePub downloads, according to the available data) and Abstracts Views on Vision4Press platform.
Data correspond to usage on the plateform after 2015. The current usage metrics is available 48-96 hours after online publication and is updated daily on week days.
Initial download of the metrics may take a while.