Fig. 3
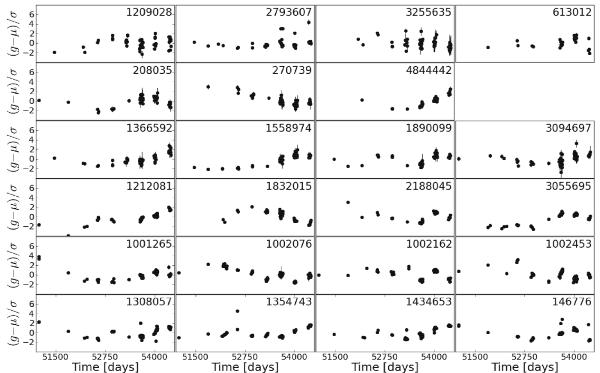
Example lightcurves with maximum evidence for constant model with additional noise (first row), for sinusoid with flat prior in period (second row), for two sinusoids (third row), for Wiener process (fourth row), for OU process (fifth row), and for Cauchy CAR(1) process (sixth row). In order to facilitate comparison for this figure, all lightcurves have been standardised by subtracting the mean and dividing by the standard devition. Numbers in the top right corners of each panel provide this QSO’s ID from Ivezić et al. (2007).
Current usage metrics show cumulative count of Article Views (full-text article views including HTML views, PDF and ePub downloads, according to the available data) and Abstracts Views on Vision4Press platform.
Data correspond to usage on the plateform after 2015. The current usage metrics is available 48-96 hours after online publication and is updated daily on week days.
Initial download of the metrics may take a while.