Fig. 1
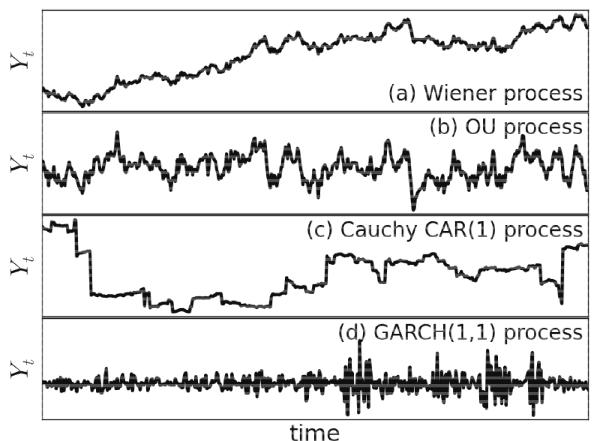
Examples of stochastic processes. We can see qualitative differences by eye: The Wiener process in panel a) drifts away, whereas the OU process in panel b) reverts to the mean. The Cauchy process in panel c) has “steps” due to the heavy tails of the Cauchy distribution. The GARCH(1,1) process in panel d) exhibits episodes of low and high variation.
Current usage metrics show cumulative count of Article Views (full-text article views including HTML views, PDF and ePub downloads, according to the available data) and Abstracts Views on Vision4Press platform.
Data correspond to usage on the plateform after 2015. The current usage metrics is available 48-96 hours after online publication and is updated daily on week days.
Initial download of the metrics may take a while.