Fig. 3
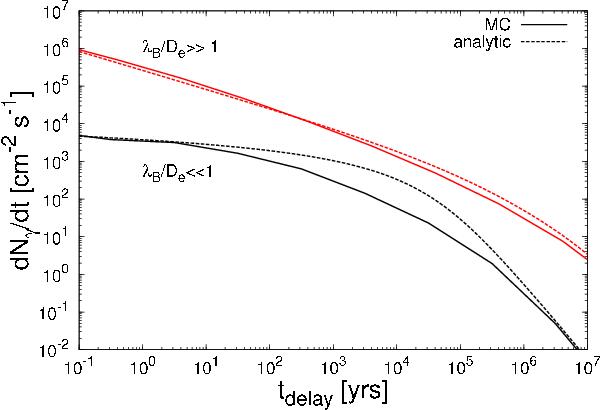
Time-delay in the arriving γ-ray flux following a flaring episode obstained with both Monte Carlo and analytic (Eq. (22)) methods. The time’s shown are measured relative to the straight line (SO in Fig. 1) arrival time. For this plot, the time-delay of 1−3 GeV photons in a cascade from a source at z = 0.13 for a 10-15 G IGMF with coherence lengths 10 kpc (black lines) and 10 Mpc (red lines) are shown.
Current usage metrics show cumulative count of Article Views (full-text article views including HTML views, PDF and ePub downloads, according to the available data) and Abstracts Views on Vision4Press platform.
Data correspond to usage on the plateform after 2015. The current usage metrics is available 48-96 hours after online publication and is updated daily on week days.
Initial download of the metrics may take a while.