Fig. 3
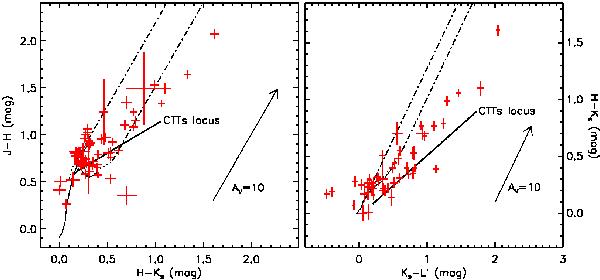
Color–color diagrams with photometric data from Table 2. Data are shown as red crosses, the giant and dwarf sequences (thin continuous lines) from Bessell & Brett (1988), the CTTS locus (Meyer et al. 1997), and a reddening vector of length AV = 10 mag (Cohen et al. 1981) are overplotted. The dotted locus just above the dwarf sequence is the sequence derived from PMS stars in Luhman et al. (2010). Targets between the two dash-dotted lines can be dereddened to the PMS locus.
Current usage metrics show cumulative count of Article Views (full-text article views including HTML views, PDF and ePub downloads, according to the available data) and Abstracts Views on Vision4Press platform.
Data correspond to usage on the plateform after 2015. The current usage metrics is available 48-96 hours after online publication and is updated daily on week days.
Initial download of the metrics may take a while.