Fig. 2
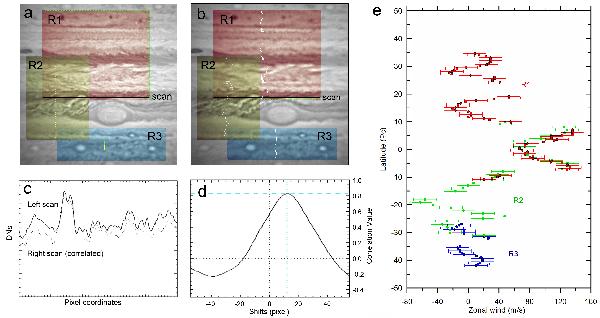
Panels a) and b) show projected images obtained with a time separation of one planetary rotation. Regions where correlation scans were obtained are shaded areas labeled R1, R2, and R3. These regions were selected close to the central meridian of the original images, avoiding areas with large-scale features. Each region is decomposed in zonally long and latitudinally narrow stripes, which are compared with their equivalent latitudes in the second image with a correlation algorithm. The software draws wind vectors in each measurement. Panel c) shows a zonal scan (continuous line) on the R1 region in the left panel and its equivalent scan in the region R2 in the right panel (dashed line) after identifying the zonal shift that attains the maximum correlation between both scans. Panel d) shows the correlation function between these scans. Panel e) shows winds obtained in this image pair. Color codes correspond to measurements obtained in each region. Error bars here are 15 ms-1 from the spatial resolution and time separation.
Current usage metrics show cumulative count of Article Views (full-text article views including HTML views, PDF and ePub downloads, according to the available data) and Abstracts Views on Vision4Press platform.
Data correspond to usage on the plateform after 2015. The current usage metrics is available 48-96 hours after online publication and is updated daily on week days.
Initial download of the metrics may take a while.