Free Access
Fig. 10
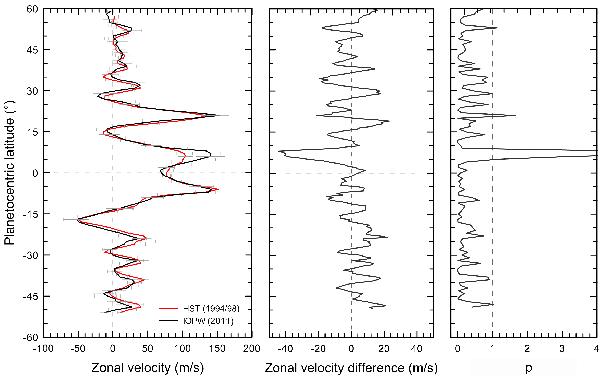
Comparison between the mean Jupiter profile obtained from the 1994 to 1998 wind profile using HST images (García-Melendo & Sánchez-Lavega 2001) and the 2011 wind profile from this work. Left panel shows the wind profiles; the middle panel shows the difference between both profiles; the right panel shows the p parameter.
Current usage metrics show cumulative count of Article Views (full-text article views including HTML views, PDF and ePub downloads, according to the available data) and Abstracts Views on Vision4Press platform.
Data correspond to usage on the plateform after 2015. The current usage metrics is available 48-96 hours after online publication and is updated daily on week days.
Initial download of the metrics may take a while.