Fig. 6
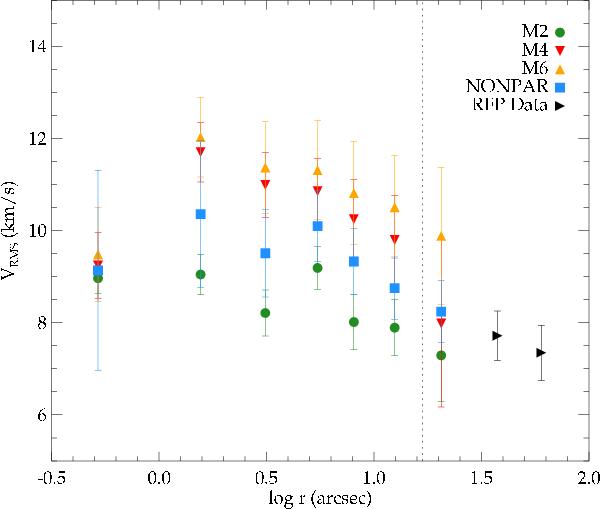
Velocity-dispersion profiles with error bars. Different symbols indicate different methods of calculation. M2, M4, and M6 are the profiles computed with pPXF, fitting only the first 2, 4, or 6 moments, respectively. The squares denote the profile calculated with the nonparametric method. The triangles are from outer kinematic data, and the dotted vertical line denotes the core radius at 16.8′′ (Harris 1996).
Current usage metrics show cumulative count of Article Views (full-text article views including HTML views, PDF and ePub downloads, according to the available data) and Abstracts Views on Vision4Press platform.
Data correspond to usage on the plateform after 2015. The current usage metrics is available 48-96 hours after online publication and is updated daily on week days.
Initial download of the metrics may take a while.