Fig. 4
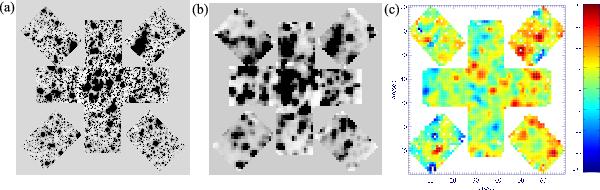
a) Synthetic image cut to the ARGUS pointings; b) reconstructed ARGUS image; and c) velocity map. Colors are as indicated by the color bar in units of km s-1. The blue spaxels of the velocity map indicate approaching stars, the red spaxels are receding stars. White spaxels mean that within this spaxel no spectrum was found that could be used to determine the fit parameters. North is right, east is up.
Current usage metrics show cumulative count of Article Views (full-text article views including HTML views, PDF and ePub downloads, according to the available data) and Abstracts Views on Vision4Press platform.
Data correspond to usage on the plateform after 2015. The current usage metrics is available 48-96 hours after online publication and is updated daily on week days.
Initial download of the metrics may take a while.