| Issue |
A&A
Volume 554, June 2013
|
|
|---|---|---|
| Article Number | A130 | |
| Number of page(s) | 8 | |
| Section | Stellar structure and evolution | |
| DOI | https://doi.org/10.1051/0004-6361/201220998 | |
| Published online | 17 June 2013 | |
Research Note
Synthetic horizontal branch morphology for different metallicities and ages under tidally enhanced stellar wind
1 National Astronomical Observatories/Yunnan Observatory, the Chinese Academy of Sciences, 650011 KunMing, PR China
e-mail:
This email address is being protected from spambots. You need JavaScript enabled to view it.
2 Key Laboratory for the Structure and Evolution of Celestial Objects, the Chinese Academy of Sciences, 650011 KunMing, PR China
3 University of the Chinese Academy of Sciences, Beijing 100049, PR China
Received: 24 December 2012
Accepted: 8 April 2013
Abstract
Context. It is believed that some other parameters, except for metallicity (the first parameter), are needed to explain the horizontal branch (HB) morphology of globular clusters (GCs). Furthermore, these parameters are considered to be correlated with the mass loss of the red giant branch (RGB) stars. Unfortunately, the physics of mass loss on the RGB is poorly understood at present. In our previous work, we proposed that tidally enhanced stellar wind during binary evolution may affect the HB morphology by enhancing the mass loss of the red giant primary and that we can reproduce the basic morphology of HB in GCs.
Aims. We did not consider the effects of other important parameters (e.g., metallicity and age) in our final results there. As a further study, we now investigate the effects of metallicity and age on HB morphology by considering tidally enhanced stellar winds during binary evolution.
Methods. We incorporated the tidally enhanced-stellar-wind model of Tout & Eggleton into Eggleton’s stellar evolution code to study the binary evolution. A group of binary system samples were generated by Monte Carlo simulations. The position of each sample star in a color-magnitude diagram was obtained by transforming temperature and luminosity into B − V color and absolute magnitude. To study the effects of metallicity and age on our final results, we conducted two sets of model calculations: (i) for a fixed age, we used three metallicities, namely Z = 0.0001, 0.001 and 0.02; (ii) for a fixed metallicity, Z = 0.001, we used five ages in our model calculations: 14, 13, 12, 10, 7 Gyr.
Results. We found that HB morphology of GCs becomes bluer with decreasing metallicity, and old GCs present bluer HB morphology than young ones. These results are consistent with previous work. Although the envelope-mass distributions of zero-age HB stars produced by tidally enhanced stellar wind are similar for different metallicities, the synthetic HB under tidally enhanced stellar wind for Z = 0.02 presented a distinct gap between red and blue HB. However, this feature was not seen clearly in the synthetic HB for Z = 0.001 and 0.0001. We also found that higher binary fractions may make HB morphology become bluer, and we discuss the results with recent observations.
Key words: Hertzsprung-Russell and C-M diagrams / stars: horizontal-branch / stars: mass-loss / globular clusters: general
© ESO, 2013
1. Introduction
The color distribution of horizontal branch (HB) stars in the color-magnitude diagram (CMD) of globular clusters (GCs), which is defined as HB morphology, is a longstanding problem in stellar evolution. Although the most important factor affecting HB morphology is identified as the metallicity (called the first parameter, Sandage & Wallerstein 1960), other parameters are also believed to play an important role in this problem. These parameters are called the second parameter (2P). However, the nature of the 2P is still unknown. Many 2P candidates have been proposed in the past five decades (for a recent review see Catelan 2009; also see Lei et al. 2013; hereafter Paper I), but none of them can explain the whole HB morphologies in GCs. Recently, some researchers have suggested that, except for metallicity, age may be the main global parameter affecting HB morphology in GCs, while some other parameters are needed as the third parameter, such as helium abundance and central density (Gratton et al. 2010; Dotter et al. 2010). Moreover, the second parameter problem is considered to be correlated with multiple populations discovered in GCs (Piotto et al. 2007, 2012; Carretta et al. 2010; Gratton et al. 2012).
Mass loss on the red giant branch (RGB) is a very important process in understanding the 2P problem in GCs (Catelan 2009), since the color distribution of HB stars in CMD depends on their envelope masses, while the envelope mass is determined by the mass loss on the RGB. Unfortunately, the physics of mass loss on the RGB is poorly known at present (Willson 2000; Dupree et al. 2009). Thus, in order to reproduce the color distribution of HB stars in the CMD of GCs, most of the 2P candidates need to assume a mass-loss dispersion on the RGB (e.g., Gaussian distribution of mass with a mass dispersion for HB stars; Lee et al. 2000, 1994; D’Antona & Caloi 2004; Percival & Salaris 2011). However, the assumption of mass-loss dispersion is arbitrary and has no any physical justification.
In our previous work (see Paper I), we proposed that tidally enhanced stellar wind during binary evolution may affect the HB morphology in GCs by enhancing the mass loss of the red giant primary. In a red giant binary system, the stellar wind of the red giant primary may be tidally enhanced by the secondary. The exact mass loss of the primary stars on the RGB depends on the initial binary orbital period. Therefore different initial binary orbital periods lead to different mass loss of the primary on the RGB. After the ignition of helium in their cores, the primary stars are located in different positions of the HB. In Paper I, under consideration of tidally enhanced stellar wind and without any additional assumptions of mass-loss dispersion on the RGB, we can reproduce the basic HB morphology of GCs, in which red, blue, and extreme HB are all populated. However, we do not know exactly how other important parameters (e.g., metallicity and age) affect our results obtained in Paper I. As further study, in this paper, using the same method as described in Paper I, we study the effects on HB morphology for different metallicities and ages by considering the tidally enhanced stellar wind during binary evolution.
The structure of this paper is as follows. In Sect. 2, we introduce the method and code used in this paper. Our results are given in Sect. 3. A discussion and conclusions are given in Sects. 4 and 5, respectively.
2. Method and code
As described in Paper I, in this work, we also incorporate tidally enhanced stellar wind during binary evolution (see Sect. 2.2) into Eggleton’s stellar evolution code (see Sect. 2.1) to calculate the stellar mass and the helium core mass of the primary star at the helium flash (hereafter MHF and Mc,HF, respectively). Then, MHF, Mc,HF, and a lifetime spent on the HB are used to obtain the exact position of the primary star (e.g., effective temperature and luminosity) on the HB in the Hertzsprung-Russell (H-R) diagram by interpolating among constructed HB evolutionary tracks. All the HB evolutionary tracks are constructed using modules for experiments in stellar astrophysics (MESA; Paxton et al. 2011; see Paper I for details). Finally, we transform the effective temperature and luminosity of each HB star into B − V colors and absolute magnitudes, MV, to obtain the synthetic HB morphology in CMD. All these processes are carried out for different metallicities and ages to investigate the effects of these two parameters on the final results.
2.1. Stellar evolution code
Eggleton’s stellar evolution code was developed in the early 1970s (Eggleton 1971, 1972, 1973). This code has been updated with the latest input physics over the past four decades (Han et al. 1994; Pols et al. 1995, 1998). Now, this code is being applied extensively in the field of stellar evolution. In our calculations, the ratio of mixing length to local pressure scale height, α = l/HP, is set to 2.0. The convective overshooting parameter, δov, is set to 0.12 (Pols et al. 1997). The opacity used in our calculations was compiled by Chen & Tout (2007). We obtain the initial hydrogen mass fraction, X, by X = 0.76 − 3Z, where Z is the metallicity (Pols et al. 1998).
2.2. Tidally enhanced stellar wind
We use the same equation as in Paper I to describe the tidally enhanced stellar wind during binary evolution, ![Mathematical equation: \begin{equation} \dot{M}=-\eta4\times10^{-13}(RL/M)\left\{1+B_{\rm w}\times \rm min \left[\it(R/R_{\rm L})^{6}, \rm 1/2^{6}\right]\right\}, \end{equation}](/articles/aa/full_html/2013/06/aa20998-12/aa20998-12-eq13.png) (1)where η is the Reimers mass-loss efficiency, RL is the radius of the Roche lobe, Bw is the tidal enhancement efficiency, and R, L, M are in solar units. This form of stellar wind was first suggested by Tout & Eggleton (1988) to explain the mass inversion phenomenon found in some RS CVn binary systems (see Paper I for detail). We incorporate Eq. (1) into Eggleton’s stellar evolution code to calculate MHF and Mc,HF of the primary star.
(1)where η is the Reimers mass-loss efficiency, RL is the radius of the Roche lobe, Bw is the tidal enhancement efficiency, and R, L, M are in solar units. This form of stellar wind was first suggested by Tout & Eggleton (1988) to explain the mass inversion phenomenon found in some RS CVn binary systems (see Paper I for detail). We incorporate Eq. (1) into Eggleton’s stellar evolution code to calculate MHF and Mc,HF of the primary star.
From our previous result in Paper I, the HB morphology is not very sensitive to the tidal enhancement parameter,Bw. For this reason, Bw is set to 10 000 (e.g., the typical value used in Tout & Eggleton 1988) in all sets of calculations in this paper. Reimers mass-loss efficiency (Reimers 1975), η, is set to 0.45 (see the discussion in Sect. 4.2). To study the effects of metallicity and age on the HB morphology by considering tidally enhanced stellar wind, we carry out two sets of calculations: (i) for a fixed age of 13 Gyr, we use three different metallicities, namely Z = 0.0001, 0.001, and 0.02. For these three metallicities, the stellar mass of the primary at zero-age main sequence (hereafter MZAMS) are 0.80, 0.83 and 0.98 M⊙ respectively. (ii) For a fixed metallicity of GCs, Z = 0.001, we use five MZAMS in our model calculations, namely 0.80, 0.83, 0.85, 0.89, and 0.97 M⊙. These five masses correspond to cluster ages of 14, 13, 12, 10, and 7 Gyr, respectively. The detailed information for the two sets of calculations are shown in Table 1. The columns from left to right provide the metallicity, MZAMS, and the age of the primary star at helium flash, respectively. The results of the two sets of calculations are given in Tables 2 and 3 (see Sect. 3.1).
The mass ratio of primary to secondary is set to 1.6 (we used different mass ratios of primary to secondary in Paper I, but it has little influence on our results). We assume that the mass accreted by the secondary from the stellar wind is retained in the binary system, and the angular momentum that leaves the binary system due to the stellar wind is attributed to the primary star.
2.3. Initial binary samples
To obtain the synthetic HB morphology in CMD, we generate several groups of binary systems, in which the metallicity and MZAMS of the primary stars correspond to the values given in Table 1. The mass ratio of primary to secondary is set to 1.6 (see Sect. 2.2). The initial orbital periods of all binary systems are produced by Monte Carlo simulations. The distribution of separation in binary is constant in log a (a is the separation) and falls off smoothly at small separations,  (2)where αsep ≈ 0.07, a0 = 10 R⊙, a1 = 5.75 × 10⁶ R⊙ = 0.13 pc and m ≈ 1.2. This distribution implies that the number of wide binaries per logarithmic interval are equal and about 50% of stellar systems have orbital periods less than 100 yr (Han et al. 2003).
Information for the two sets of calculations in this paper.
MHF, Mc,HF, and Menv of the primary with various initial binary orbital periods for different metallicities at a fixed age of 13 Gyr.
3. Results
3.1. MHF and Mc,HF of the primary star for different metallicities and ages.
Table 2 shows the results of our model calculation for different metallicites, and it gives the MHF, Mc,HF, and the envelope mass of the primary stars at the helium flash (Menv) with various initial binary orbital periods at a fixed age of 13 Gyr. The results in Table 2 correspond to the calculation of set (i) (see Sect. 2.2). Recall that Bw is set to 104 and η is set to 0.45. The mass ratio of primary-to-secondary, q, is set to be 1.6. The columns from left to right provide the initial orbital periods, MHF, Mc,HF, and Menv, respectively.
For each metallicity, the first binary orbital period in Table 2 is a minimum period (e.g., log P/day = 3.126 for MZAMS = 0.8 M⊙ at metallicity of Z = 0.0001), above which a helium flash could take place. For orbital periods shorter than this critical value1, the primary stars experience too much mass loss on the RGB due to the tidally enhanced stellar wind, and fail to ignite helium in their cores. Therefore, these primary stars will not undergo the HB phase and evolve into helium white dwarf (WD) cooling curve directly. With the increase in binary orbital period, the amount of mass loss of the primary star on the RGB decreases for each metallicity. When the initial binary orbital period is long enough, the tidally enhanced stellar wind becomes unimportant and has little effect on the mass loss of red giant primary (One can see that the Menv of primary stars with log P/day = 3.55 and log P/day = 10.0 for MZAMS = 0.8 M⊙ at the metallicity of Z = 0.0001 are nearly the same, which means that they experience nearly the same amount of mass loss on the RGB.). At this time, the primary star just loses its envelope mass through Reimers mass-loss law (Reimers 1975).
Similar to Table 2, Table 3 presents our model calculation results for different ages at metallicity of Z = 0.001, which corresponds to the calculation of set (ii) (see Sect. 2.2).
MHF, Mc,HF, and Menv of the primary with various initial binary orbital periods for different ages at Z = 0.001.
3.2. Synthetic HB morphology in CMD for different metallicities
To obtain the position of each sample star on the HB in the H-R diagram (e.g., effective temperatures and luminosities), we need to know MHF, Mc,HF, and the time spent on HB phase which means how long the HB star has been evolved from zero-age HB (ZAHB). The value of MHF and Mc,HF for each primary star in this set of calculation are obtained by interpolating with the results presented in Table 2. The time spent on the HB is generated by a uniform random number between 0 and the HB lifetime, τHB (Rood 1973; Lee et al. 1990; Dalessandro et al. 2011). Here, τHB is set to be the lifetime of HB star with the lowest stellar mass among the constructed HB evolutionary tracks, which means that this star has the longest lifetime on the HB. Therefore, some of HB stars are given a time longer than their lifetimes on the HB, and these stars are considered to evolve into the next evolutionary phase (e.g., AGB or WD). This process is equivalent to the scenario that stars enter the HB from the RGB at a constant rate (see Lee et al. 1990). We use MHF, Mc,HF, and the time spent on HB phase to obtain the exact position of each primary star on HB in the H-R diagram by interpolating among constructed HB evolutionary tracks. After that, we transform the temperature and luminosity of each HB star into B − V color and absolute magnitude, MV, using the Basel stellar spectra library (Lejeune et al. 1997, 1998). Finally, we obtain the synthetic HB in CMD.
Figure 1 shows the synthetic HB for three different metallicities under the tidally enhanced stellar wind. The metallicities from the top to bottom panels in Fig. 1 are Z = 0.02, 0.001, and 0.0001, respectively. The corresponding MZAMS are 0.98, 0.83, and 0.80 M⊙. In the top panel of Fig. 1, the synthetic HB has a high metallicity of Z = 0.02. Most of HB stars in this panel locate in red HB (e.g., 95%), while stars in blue and extreme HB are just about 5%. One can see clearly in this panel that there is a distinct gap between red and blue HB, and a few of HB stars are located in the RR Lyrae instability strip. However, this bimodal HB morphology is not presented clearly in the other two panels of Fig. 1. We discuss this result in Sect. 4.1. For the whole figure, with the metallicity decreasing from the top to bottom panels, more and more HB stars settle on blue and extreme HB. For the extreme case, in the bottom panel of Fig. 1, which has the lowest metallicity of Z = 0.0001 in our calculations, all HB stars are located in the region that is bluer than the RR Lyrae instability strip, with no red HB stars and RR Lyrae stars are produced. Figure 1 shows the typical effect of metallicity (the first parameter) on HB morphology in GCs, which is that metal-poor GCs present bluer HB morphology than the metal-poor ones. This is because the metal-poor GCs have a lower stellar mass than the metal-rich ones at the tip of RGB for a fixed cluster age. As a result, assuming that the mass-loss law on the RGB is the same, it is much easier for the metal-poor stars to settle on blue HB positions than for the metal-rich ones. Moreover, for the same envelope mass, the metal-poor HB stars have much higher effective temperatures on the ZAHB than the metal-rich ones owing their lower opacity in envelopes. This fact could also make the metal-poor HB stars occupy blue HB positions more easily than the metal-rich ones.
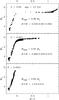 |
Fig. 1 Synthetic HB morphology produced by tidally enhanced stellar wind for different metallicities at a fixed age of 13 Gyr. The metallicities from the top panel to the bottom panel are Z = 0.02, 0.001, 0.0001, for which the primary mass are 0.98, 0.83, and 0.80 M⊙, respectively. HB stars in RR Lyrae strip (defined by the vertical region of 3.80 ≤ log Teff ≤ 3.875 in the H-R diagram, Koopmann et al. 1994; Lee et al. 1990) are denoted by crosses. Other HB stars are denoted by solid dots. The label of B:V:R in this figure is the number ratio of HB stars located in the region bluer than (or to the left of), within, and redder than (or to the right of) the RR Lyrae instability strip in the H-R diagram. |
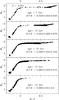 |
Fig. 2 Similar to Fig. 1, but for different ages at Z = 0.001. The MZAMS of the primary star from the top to bottom panels are 0.97, 0.89, 0.85, 0.83, and 0.80 M⊙, which corresponds to cluster ages of 7, 10, 12, 13, and 14 Gyr, respectively. |
3.3. Synthetic HB morphology in CMD for different ages
The synthetic HB morphology in CMD for different ages at a fixed metallicity of Z = 0.001 are obtained in a similar way to the one used in Sect. 3.2, but the value of MHF and Mc,HF for each sample star in this set of calculation are obtained by interpolating with the results in Table 3.
Figure 2 shows five synthetic HB in CMD with different ages of GCs at metallicity of Z = 0.001. The MZAMS of the primary star in Fig. 2 from the top to bottom panels are 0.97, 0.89, 0.85, 0.83, and 0.80 M⊙. These five masses correspond to cluster ages of about 7, 10, 12, 13, and 14 Gyr, respectively. The label of B:V:R in Fig. 2 has the same meaning as in Fig. 1.
One can see clearly in Fig. 2 that, with the age increasing from the top to the bottom panel, more and more HB stars are located in blue and extreme HB. Especially in bottom panel of Fig. 2, which corresponds to the largest cluster age of about 14 Gyr in our model calculations, the synthetic HB is nearly a whole blue HB, and no red HB stars are produced. Figure 2 indicates that old GCs will present bluer HB morphology than the young ones. This is because that old GCs have a lower stellar mass than the young ones at the RGB tip for a fixed metallicity. Therefore, the stars in old GCs settle more easily on blue HB positions than the stars in young GCs if they follow the same mass-loss law on the RGB.
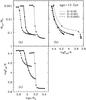 |
Fig. 3 Panel a) envelope mass distribution of ZAHB stars produced by the tidally enhanced stellar wind. Panel b) relationship between the envelope mass and effective temperature of ZAHB stars. Panel c) effective temperature distribution of ZAHB stars produced by the tidally enhanced stellar wind. The dashed, solid, and dotted curves in each panel correspond to the model calculations for three different metallicities as in Fig. 1, namely Z = 0.0001, 0.001, 0.02, respectively. The two adjacent solid dots in each curve of these three panels denote a fixed separation interval of Δlog a/R⊙ = 0.025 (a is the separation of binary system). |
4. Discussion
4.1. Bimodality on HB
From the top panel of Fig. 1, in which the metallicity is Z = 0.02, one can see that there is a distinct gap between red and blue HB. However, this bimodal HB distribution is not seen clearly in our synthetic HB for Z = 0.001 and 0.0001 in Fig. 1, which indicates that metal-rich GCs are more likely to form a bimodal HB than the metal-poor ones. To discuss the physical reason for this result, we present three panels in Fig. 3. The dashed, solid and dotted curves in each panel correspond to the model calculations for three different metallicities as in Fig. 1, namely Z = 0.0001, 0.001, and 0.02.
Panel (a) gives the envelope mass distribution of ZAHB stars produced by the tidally enhanced stellar wind. Since the distribution of separation in log a is constant when the separation, a, is larger than 10 R⊙ (see Sect. 2.3), the number of the initial binary systems in each fixed separation interval (i.e., 0.025) is the same. Therefore, the higher the concentration of the solid dots in each curve, the more ZAHB stars will be produced in this envelope mass range. One can see clearly from panel (a) of Fig. 3 that the envelope mass distributions produced by the tidally enhanced stellar wind for three different metallicities are similar and that the number of ZAHB stars with their envelope masses in the rough range of 0.003 M⊙ ≲ Menv ≲ 0.06 M⊙ is obviously less than the number of ZAHB stars with the envelope mass beyond this range.
Panel (b) of Fig. 3 shows the relationship between the envelope mass and the effective temperatures of ZAHB stars. One can see clearly that, for Z = 0.02, a large gap is presented within the effective temperature range of 3.8 ≲ log Teff ≲ 4.3. However, for Z = 0.001 and 0.0001, the sparse area on ZAHB occupies a much narrower and bluer effective temperature range than that of Z = 0.02. This is because the opacity of metal-poor HB stars in their envelopes is less than the metal-rich ones. Furthermore, due to the decreasing sensitivity of B − V color to effective temperature towards higher temperatures (Moehler 2010) and due to the vertical evolution of hot HB stars in H-R diagram (see Fig. 1 in Paper I), the small gap on HB for metal-poor GCs in CMD may become obscure.
Panel (c) in Fig. 3 is the combination of panels (a) and (b), which shows the relationship between the initial separations of binary systems and the effective temperatures of ZAHB stars produced by tidally enhanced stellar wind. One can see that the distribution of HB stars is clearly bimodal for Z = 0.02. However, this feature becomes more and more obscure with decreasing metallicity, which means that in our model calculation, metal-rich GCs are more likely to form a bimodal HB morphology than the metal-poor ones.
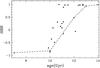 |
Fig. 4 Relationship between the age and the HB morphology parameter, HBR, in GCs. The solid circles are the selected GCs in our Galaxy, which are in the metallicity range of −1.6 < [Fe/H] < −1.1. The open circles denote our model calculations in Fig. 2, which from left to right correspond to cluster ages of 7, 10, 12, 13, and 14 Gyr, respectively. |
4.2. age-HBR diagram in GCs
One can see from Fig. 2 that old GCs present bluer HB morphology than the young ones. To compare this result with the observation in GCs, we show in Fig. 4 the relationship between the age of GCs in our Galaxy and the parameter, HBR, which is used to describe the HB morphology of GCs (Lee et al. 1990; Lee et al. 1994). The parameter, HBR, is defined as,  (3)where B,V, and R have the same meanings as described in Sect. 3.2. The value of the parameter, HBR, is in the range of −1 to 1. The value of −1 means that all HB stars settle on red HB; on the other hand, the value of 1 means that GC presents a whole blue HB. Therefore, the larger the HBR parameter, the bluer the HB morphology in GCs. The values of HBR parameter for GCs in Fig. 4 are from the catalog of Harris (1996), and the age of GCs used in this figure is from Gratton et al. (2010)2. To compare the observation with our results, we chose the GCs in the metallicity range of − 1.6 < [Fe/H] < − 1.1 in Fig. 4, which is around the metallicity used in Fig. 2 (i.e., Z = 0.001 or [Fe/H] = − 1.3). This limit weakens the effect of metallicity on HB morphology, thus the effect of age on HB morphology could be revealed more clearly.
One can see in Fig. 4 that, for the selected GCs in our Galaxy, the value of HBR increases with the increasing age of the GCs, which means the HB morphology becomes bluer when the ages of the GCs become older. This result is consistent with the one obtained from Fig. 2, and also can be seen clearly from the dashed line in Fig. 4. However, for a fixed age of GCs, our synthetic HB produced by a tidally enhanced stellar wind in Fig. 4 is a little redder than the observed ones. This may be because we do not consider the common envelope (CE) and Roche lobe overflow (RLOF) processes in binary evolution for our calculations (see Sect. 3.1 and Paper I). These processes can produce EHB stars (Han et al. 2002, 2003), and thus make HB bluer.
We also adopted a different value of Reimers mass-loss efficiency (e.g., η = 0.25, which is the value we used in Paper I) in our model calculations. We found that, for η = 0.25, the result is similar to the one in Fig. 4. However, to produce a blue HB morphology (e.g., HBR ≳ 0.5), the age of GCs should be greater than 15 Gyr. This indicates that η = 0.25 is too small to produce the observed HB morphology in GCs. Renzini & Fusi Pecci (1988) demonstrated that observed HB morphologies in GCs with Z ≃ 0.001 demand η = 0.4 ± 0.04. That is why we use the value of η = 0.45 in this paper, but it does not influence the results we obtained in Paper I, since we can obtain the same results using a little younger age of GCs for a higher value of η.
4.3. Effects of binary fraction on HB morphology
In our model calculations, all stars are in binary systems, but the binaries with long orbital periods are actually single stars. The separation distribution of binary systems described in Sect. 2.3 implies that about 50% of binary systems have orbital periods that all shorter than 100 yr. To investigate the effects of binary fractions on our final results, we also adopted various binary fractions in our calculations (i.e., 10%, 15%, 20%, 30%, and 80%)3. The result of model calculation for a binary fraction of 80% is shown in Figs. 5 and 6. The input parameters in Figs. 5 and 6 are the same as in Figs. 1 and 2, except for the binary fraction.
By comparing Figs. 5 and 1, one can see that, with the binary fraction increasing, the number ratio of HB stars bluer than the RR Lyrae instability strip increases, while the number ratio of red HB stars decreases. For example, in the top panel of Fig. 5, the number ratio of HB stars bluer than RR Lyrae instability strip is 15.9%, as opposed to 4.5% in the top panel of Fig. 1; while the number ratio of red HB stars is 83.6%, versus 95.4% in the top panel of Fig. 1. We can also obtain this result by comparing Figs. 6 and 2, and the model calculations for binary fraction of 10%, 15%, 20%, and 30% show similar results. These results indicate that higher binary fraction may make HB morphology become bluer. This is because the orbital period in which tidally enhanced stellar wind significantly affects mass loss of the primary star is from log P/day ≈ 3.1 to log P/day ≈ 3.5 (see Tables 2 and 3), and the orbital periods of binaries in this range are less than 100 yr. Therefore, for a given total number of binary samples, when the fraction of binary systems with their binary orbital periods less than 100 yr increases, more primary stars will be influenced by tidally enhanced stellar winds, and then more blue and extreme HB stars will be produced.
Our results indicate that higher binary fraction may make the HB morphology become bluer, which implies that binary population is a possible second parameter candidate. However, Milone et al. (2012) estimate the binary fraction for 59 Galactic GCs by analyzing the number of stars located on the red side of the main-sequence fiducial line (also see Sollima et al. 2007). Moreover, they studied the relationship between the binary fraction and the HB morphology parameters, and conclude that there is weak or null impact of binary populations on HB morphology (see Fig. 47 and Sect. 5.6.3 in their paper). At first glance, their results contradict ours. However, the sample GCs in Milone et al. (2012) have different metallicities and ages, which are very important parameters that affect HB morphology in GCs (Gratton et al. 2010; Dotter et al. 2010). Therefore, Milone et al. (2012) did not remove the effects of metallicity and age on HB morphology when studying the effect of binary fraction on HB morphology, and this will significantly influence the final results4. On the other hand, our result that higher binary fraction may make HB morphology become bluer is obtained by comparing GCs with fixed metalicity and age but different binary fractions. This means that we removed the effects of metalicity and age when studying the effects of binary fraction on HB morphology. Thus, the results obtained by Milone et al. (2012) cannot exclude binary populations as a second parameter candidate that may affect HB morphology in GCs.
One can also see that, though the binary fraction is higher than in Fig. 1, the synthetic HB for Z = 0.02 in the top panel of Fig. 5 still presents a distinct gap between red and blue HB, with very few of the HB stars located in RR Lyrae instability strip. (Similar results are obtained for other different binary fractions.) This result indicates that binary fraction may have little effect on the bimodality of HB, and the bimodality of HB may mainly depend on the metallicity of GCs (see our discussion in Sect. 4.1).
5. Conclusions
In this paper, we considered tidally enhanced stellar winds during binary evolution to study the effects on the HB morphology of GCs with different metallicities and ages. We found that metal-poor GCs should present bluer HB morphology than the metal-rich ones, and this is consistent with previous work. Furthermore, we found in our calculations that the envelope-mass distributions of ZAHB stars produced by a tidally enhanced stellar wind are very similar for different metallicities. However, the synthetic HB for Z = 0.02 produced by tidally enhanced stellar wind presents a distinct gap between red and blue HB, while this feature is not seen clearly in the synthetic HB for Z = 0.001 and 0.0001. We also found that old GCs present bluer HB than the young ones, which is also consistent with previous work. We compared our results with the observation in the age-HBR diagram of GCs. Furthermore, we studied the effect of binary fraction on our final results, and found that higher binary fraction may make HB morphology become bluer. We finally discussed our results with recent observations.
If the binary orbital period is short enough to make the the primary star fill its Roche lobe, then a Roche lobe overflow (RLOF) or a common envelope (CE) will begin in this binary system, but this is beyond the scope of present work.
All these binary fractions are for the binary systems with their orbital periods less than 100 yr.
For example, we used a binary fraction of 10% in the calculation and found that, though the binary fraction is relatively low, the synthetic HB for Z = 0.0001 at 13 Gyr is still a pure blue HB (e.g., HBR = 1). It means that the effect of metallicity may mask the effect of binary fraction on HB morphology at very low metallicity.
Acknowledgments
We thank the anonymous referee for valuable comments and suggestions that helped us to improve the paper. This work is supported by the National Natural Science Foundation of China (Grant Nos. 11033008, 11273053 and 11203065) and the Chinese Academy of Sciences (Grant No. KJCX2-YW-T24).
References
- Carretta, E., Bragaglia, A., Gratton, R. G., et al. 2010, A&A, 516, A55 [NASA ADS] [CrossRef] [EDP Sciences] [Google Scholar]
- Catelan, M. 2009, Ap&SS, 320, 261 [NASA ADS] [CrossRef] [Google Scholar]
- Chaboyer, B., Green, E. M., & Liebert, J. 1999, AJ, 117, 1360 [NASA ADS] [CrossRef] [Google Scholar]
- Chen, X. F., & Tout, C. A. 2007, Chin. J., Astron. Astrophys., 7, 245 [Google Scholar]
- Dalessandro, E., Salaris, M., Ferraro, F. R., et al. 2011, MNRAS, 410, 694 [NASA ADS] [CrossRef] [Google Scholar]
- D’Antona, F., & Caloi, V. 2004, ApJ, 611, 871 [NASA ADS] [CrossRef] [Google Scholar]
- De Angeli, F., Piotto, G., Cassisi, S., et al. 2005, AJ, 130, 116 [NASA ADS] [CrossRef] [Google Scholar]
- Dotter, A., Sarajedini, A., Anderson, J., et al. 2010, ApJ, 708, 698 [NASA ADS] [CrossRef] [Google Scholar]
- Dupree, A. K., Smith, G. H., Strader, J., et al. 2009, AJ, 138, 1485. [NASA ADS] [CrossRef] [Google Scholar]
- Eggleton, P. P. 1971, MNRAS, 151, 351 [NASA ADS] [CrossRef] [Google Scholar]
- Eggleton, P. P. 1972, MNRAS, 156, 361 [NASA ADS] [Google Scholar]
- Eggleton, P. P. 1973, MNRAS, 163, 279 [NASA ADS] [CrossRef] [Google Scholar]
- Friel, E. D., & Janes, K. A. 1993, A&A, 267, 75 [NASA ADS] [Google Scholar]
- Gratton, R. G., Carretta, E., Bragaglia, A., et al. 2010, A&A, 517, A81 [NASA ADS] [CrossRef] [EDP Sciences] [Google Scholar]
- Gratton, R. G., Carretta, E., & Bragaglia, A., 2012, A&ARv, 20, 50 [CrossRef] [Google Scholar]
- Han, Z., Podsiadlowski, P., & Eggleton, P. P. 1994, MNRAS, 270, 121 [NASA ADS] [CrossRef] [Google Scholar]
- Han, Z., Podsiadlowski, Ph., Maxted, P. F. L., Marsh, T. R., & Ivanova, N. 2002, MNRAS, 336, 449 [NASA ADS] [CrossRef] [Google Scholar]
- Han, Z., Podsiadlowski, Ph., Maxted, P. F. L., & Marsh, T. R. 2003, MNRAS, 341, 669 [NASA ADS] [CrossRef] [Google Scholar]
- Harris, W. E. 1996, AJ, 112, 1487 [NASA ADS] [CrossRef] [Google Scholar]
- Kaluzny, J., & Udalski, A. 1992, Acta Astron., 42, 29 [NASA ADS] [Google Scholar]
- Kaluzny, J., & Rucinski, S. M. 1995, A&AS, 114, 1 [NASA ADS] [Google Scholar]
- Koopmann, R. A., Lee, Y. W., Demarque, P., et al. 1994, ApJ, 423, 380 [NASA ADS] [CrossRef] [Google Scholar]
- Lee, H. C., Yoon, S. J., & Lee, Y. W. 2000, AJ, 120, 998 [NASA ADS] [CrossRef] [Google Scholar]
- Lee, Y. W., Demarque, P., & Zinn, R. 1990, ApJ, 350, 155 [NASA ADS] [CrossRef] [Google Scholar]
- Lee, Y. W., Demarque, P., & Zinn, R. 1994, ApJ, 423, 248 [Google Scholar]
- Lei, Z., Chen, X., Zhang, F., & Han, Z. 2013, A&A, 549, A145 (Paper I) [NASA ADS] [CrossRef] [EDP Sciences] [Google Scholar]
- Lejeune, T., Cuisinier, F., & Buser, R. 1997, A&AS, 125, 229 [NASA ADS] [CrossRef] [EDP Sciences] [Google Scholar]
- Lejeune, T., Cuisinier, F., & Buser, R. 1998, A&AS, 130, 65 [NASA ADS] [CrossRef] [EDP Sciences] [Google Scholar]
- Liebert, J., Saffer, R. A., & Green, E. M. 1994, AJ, 107, 1408 [NASA ADS] [CrossRef] [Google Scholar]
- Marin-Franch, A., Aparicio, A., & Piotto, G., et al. 2009, ApJ, 694, 1498 [NASA ADS] [CrossRef] [Google Scholar]
- Milone, A. P., Piotto, G., Bedin, L. R., et al. 2012, A&A, 540, A16 [NASA ADS] [CrossRef] [EDP Sciences] [Google Scholar]
- Moehler, S. 2010, MmSAI, 81, 838 [NASA ADS] [Google Scholar]
- Paxton, B., Bildsten, L., Dotter, A., et al. 2011, ApJS, 192, 3 [Google Scholar]
- Percival, S. M., & Salaris, M. 2011, MNRAS, 412, 2445 [NASA ADS] [CrossRef] [Google Scholar]
- Peterson, R. C., & Green, E. M. 1998, ApJ, 502, L39 [NASA ADS] [CrossRef] [Google Scholar]
- Piotto, G., Bedin, L. R., Anderson, J., et al. 2007, ApJ, 661, L53 [NASA ADS] [CrossRef] [Google Scholar]
- Piotto, G., Milone, A. P., Anderson, J., et al. 2012, ApJ, 760, 39 [NASA ADS] [CrossRef] [Google Scholar]
- Pols, O. R., Tout, C. A., Eggleton, P. P., & Han, Z. 1995, MNRAS, 274, 964 [NASA ADS] [CrossRef] [Google Scholar]
- Pols, O. R., Tout, C. A., Schröder, K. P., et al. 1997, MNRAS, 289, 869 [NASA ADS] [CrossRef] [Google Scholar]
- Pols, O. R., Schröder, K. P., Hurley, J. P., et al. 1998, MNRAS, 298, 525 [NASA ADS] [CrossRef] [Google Scholar]
- Reimers, D. 1975, MSRSL, 8, 369 [Google Scholar]
- Renzini, A., & Fusi Pecci, F. 1988, ARA&A, 26, 245 [NASA ADS] [CrossRef] [Google Scholar]
- Rood, R. T. 1973, ApJ, 184, 815 [NASA ADS] [CrossRef] [Google Scholar]
- Sandage, A., & Wallerstein, G. 1960, ApJ, 131, 598 [NASA ADS] [CrossRef] [Google Scholar]
- Sollima, A., Beccari, G., Ferraro, F. R., et al. 2007, MNRAS, 380, 781 [NASA ADS] [CrossRef] [Google Scholar]
- Tout, C. A., & Eggleton, P. P. 1988, MNRAS, 231, 823 [NASA ADS] [CrossRef] [Google Scholar]
- Willson, L. A. 2000, ARA&A, 38, 573 [NASA ADS] [CrossRef] [Google Scholar]
All Tables
MHF, Mc,HF, and Menv of the primary with various initial binary orbital periods for different metallicities at a fixed age of 13 Gyr.
MHF, Mc,HF, and Menv of the primary with various initial binary orbital periods for different ages at Z = 0.001.
All Figures
|
Fig. 1 Synthetic HB morphology produced by tidally enhanced stellar wind for different metallicities at a fixed age of 13 Gyr. The metallicities from the top panel to the bottom panel are Z = 0.02, 0.001, 0.0001, for which the primary mass are 0.98, 0.83, and 0.80 M⊙, respectively. HB stars in RR Lyrae strip (defined by the vertical region of 3.80 ≤ log Teff ≤ 3.875 in the H-R diagram, Koopmann et al. 1994; Lee et al. 1990) are denoted by crosses. Other HB stars are denoted by solid dots. The label of B:V:R in this figure is the number ratio of HB stars located in the region bluer than (or to the left of), within, and redder than (or to the right of) the RR Lyrae instability strip in the H-R diagram. |
| In the text | |
|
Fig. 2 Similar to Fig. 1, but for different ages at Z = 0.001. The MZAMS of the primary star from the top to bottom panels are 0.97, 0.89, 0.85, 0.83, and 0.80 M⊙, which corresponds to cluster ages of 7, 10, 12, 13, and 14 Gyr, respectively. |
| In the text | |
|
Fig. 3 Panel a) envelope mass distribution of ZAHB stars produced by the tidally enhanced stellar wind. Panel b) relationship between the envelope mass and effective temperature of ZAHB stars. Panel c) effective temperature distribution of ZAHB stars produced by the tidally enhanced stellar wind. The dashed, solid, and dotted curves in each panel correspond to the model calculations for three different metallicities as in Fig. 1, namely Z = 0.0001, 0.001, 0.02, respectively. The two adjacent solid dots in each curve of these three panels denote a fixed separation interval of Δlog a/R⊙ = 0.025 (a is the separation of binary system). |
| In the text | |
|
Fig. 4 Relationship between the age and the HB morphology parameter, HBR, in GCs. The solid circles are the selected GCs in our Galaxy, which are in the metallicity range of −1.6 < [Fe/H] < −1.1. The open circles denote our model calculations in Fig. 2, which from left to right correspond to cluster ages of 7, 10, 12, 13, and 14 Gyr, respectively. |
| In the text | |
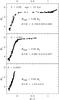 |
Fig. 5 Same as Fig. 1, but with a higher binary fraction of 80% rather than 50%. |
| In the text | |
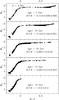 |
Fig. 6 Same as Fig. 2, but with a higher binary fraction of 80% rather than 50%. |
| In the text | |
Current usage metrics show cumulative count of Article Views (full-text article views including HTML views, PDF and ePub downloads, according to the available data) and Abstracts Views on Vision4Press platform.
Data correspond to usage on the plateform after 2015. The current usage metrics is available 48-96 hours after online publication and is updated daily on week days.
Initial download of the metrics may take a while.