Free Access
Fig. 2
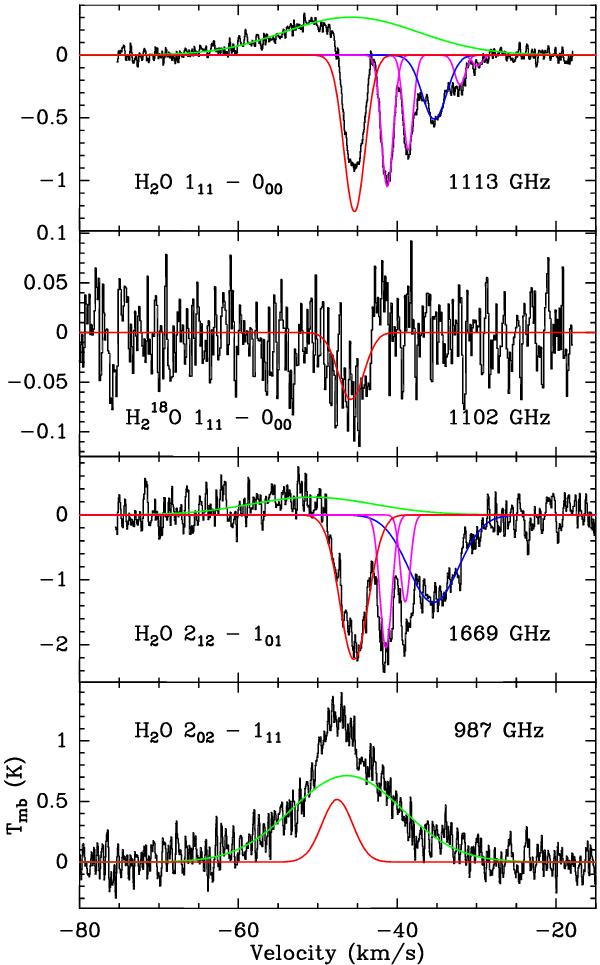
Gaussian decomposition of the observed H2O line profiles (after continuum subtraction) toward IRAS 16272. The envelope component is drawn in red, the broad outflow in green, the narrow outflow in blue, and foreground clouds in purple.
Current usage metrics show cumulative count of Article Views (full-text article views including HTML views, PDF and ePub downloads, according to the available data) and Abstracts Views on Vision4Press platform.
Data correspond to usage on the plateform after 2015. The current usage metrics is available 48-96 hours after online publication and is updated daily on week days.
Initial download of the metrics may take a while.