Free Access
Fig. 10
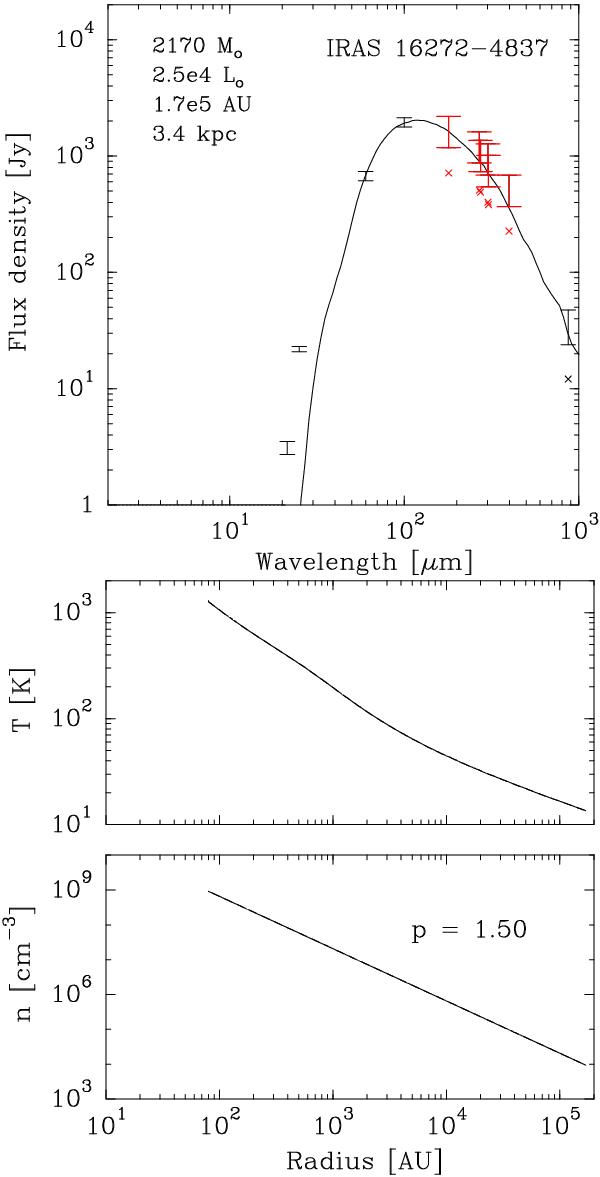
Top: model (continuous line) and observed SED fluxes (error bars) for IRAS 16272. The SED points are normalized by the source size for λ > 100 microns, as shown by the “X” symbols. Continuum flux densities from our HIFI data are labeled in red. Bottom: temperature and density profiles for IRAS 16272.
This figure is made of several images, please see below:
Current usage metrics show cumulative count of Article Views (full-text article views including HTML views, PDF and ePub downloads, according to the available data) and Abstracts Views on Vision4Press platform.
Data correspond to usage on the plateform after 2015. The current usage metrics is available 48-96 hours after online publication and is updated daily on week days.
Initial download of the metrics may take a while.