Fig. 3
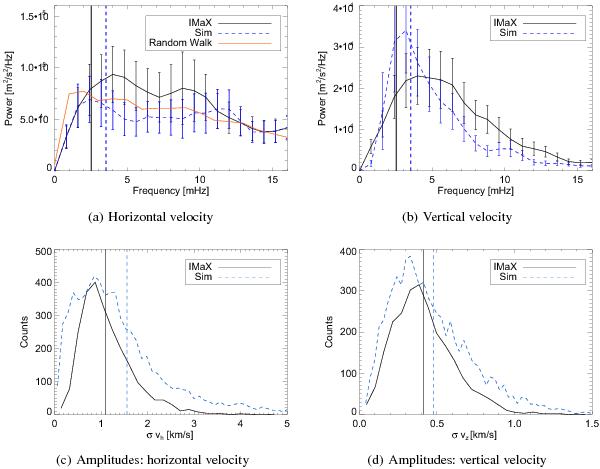
a) Power spectra of vh obtained from IMaX (solid line) and simulations (dashed line). The dot-dashed line represents the average power spectrum of 500 simulated random walks. b) Power spectra of vz obtained from IMaX and simulations. Each spectrum is the average of spectra of twenty individual features. The vertical continuous and dashed lines indicate the lowest frequency due to the total length of the time series for the vertical velocity and the horizontal velocity, respectively. c) Amplitudes of vh. d) Amplitudes of vz. The vertical continuous and dashed lines indicate the mean value for IMaX and the simulation, respectively.
Current usage metrics show cumulative count of Article Views (full-text article views including HTML views, PDF and ePub downloads, according to the available data) and Abstracts Views on Vision4Press platform.
Data correspond to usage on the plateform after 2015. The current usage metrics is available 48-96 hours after online publication and is updated daily on week days.
Initial download of the metrics may take a while.