| Issue |
A&A
Volume 554, June 2013
|
|
|---|---|---|
| Article Number | A16 | |
| Number of page(s) | 12 | |
| Section | Extragalactic astronomy | |
| DOI | https://doi.org/10.1051/0004-6361/201220926 | |
| Published online | 30 May 2013 | |
Age – metallicity relation in the Magellanic Clouds clusters⋆,⋆⋆,⋆⋆⋆
1 Section of Astrophysics Astronomy & Mechanics, Department of Physics, University of Athens, 15783 Athens, Greece
e-mail: This email address is being protected from spambots. You need JavaScript enabled to view it.
2 Institute of Astronomy and Astrophysics, National Observatory of Athens, PO Box 20048, 11810 Athens, Greece
3 Niels Bohr Institute Copenhagen University, Astronomical Observatory, Juliane Maries Vej 30, 2100 Copenhagen, Denmark
4 Facultad de Ciencias Astronomicas y Geofisicas, Universidad Nacional de La Plata, B 1900 FWA La Plata Buenos Aires, Argentina
5 Nordic Optical Telescope, Apartado 474, 38700 Santa Cruz de La Palma, Spain
Received: 14 December 2012
Accepted: 2 March 2013
Abstract
Aims. We study small open star clusters, using Strömgren photometry to investigate a possible dependence between age and metallicity in the Magellanic Clouds (MCs). Our goals are to trace evidence of an age metallicity relation (AMR) and correlate it with the mutual interactions of the two MCs and to correlate the AMR with the spatial distribution of the clusters. In the Large Magellanic Cloud (LMC), the majority of the selected clusters are young (up to 1 Gyr), and we search for an AMR at this epoch, which has not been much studied.
Methods. We report results for 15 LMC and 8 Small Magellanic Cloud (SMC) clusters, scattered all over the area of these galaxies, to cover a wide spatial distribution and metallicity range. The selected LMC clusters were observed with the 1.54 m Danish Telescope in Chile, using the Danish Faint Object Spectrograph and Camera (DFOSC) with a single 2k × 2k CCD. The SMC clusters were observed with the ESO 3.6 m Telescope, also in Chile, using the ESO Faint Object Spectrograph and Camera (EFOSC). The obtained frames were analysed with the conventional DAOPHOT and IRAF software. We used Strömgren filters in order to achieve reliable metallicities from photometry. Isochrone fitting was used to determine the ages and metallicities.
Results. The AMR for the LMC displays a metallicity gradient, with higher metallicities for the younger ages. The AMR for LMC-SMC star clusters shows a possible jump in metallicity and a considerable increase at about 6 × 10⁸ yr. It is possible that this is connected to the latest LMC-SMC interaction. The AMR for the LMC also displays a metallicity gradient with distance from the centre. The metallicities in SMC are lower, as expected for a metal-poor host galaxy.
Key words: Magellanic Clouds / galaxies: abundances / galaxies: clusters: general
Based on observations made with the Danish 1.54 m and ESO 3.6 m Telescopes at La Silla Observatory, Chile.
Table 2 and Figs. 4 to 25 are available in electronic form at http://www.aanda.org
The raw dara plotted in Figs. 3 to 25 are only available in electronic form at the CDS via anonymous ftp to cdsarc.u-strasbg.fr (130.79.128.5) or via http://cdsarc.u-strasbg.fr/viz-bin/qcat?J/A+A/554/A16
© ESO, 2013
1. Introduction
The age metallicity relation (AMR) is a very important tool for understanding the chemical evolution of a galaxy. The Magellanic Clouds (MCs), our nearest galaxies, offer ideal targets for such studies not only because of their proximity but also because the Large and the Small Magellanic Clouds (LMC and SMC), and the Milky Way form a system of interacting galaxies. It is therefore important to trace the influence of this interaction on the star formation and the chemical evolution.
The correlation between the age of the stellar clusters in the MCs and their close encounters with each other and our Galaxy has already been discussed in previous papers. In the LMC a sudden rise in the star formation rate (SFR) is traced 2 to 4 Gyr ago (Elson et al. 1997; Geisler et al. 1997) preceded by either a constant lower SFR (Geha et al. 1998) or possibly a virtual gap as manifested by the cluster age distribution (Da Costa 1991; van den Bergh 1991). The dramatic increase in the star formation due to the recent interaction has been revealed in the morphological evolution of the LMC and SMC (Maragoudaki et al. 1998, 2001).
More recently, Pietrzynski & Udalski (2000) have found that the distribution of cluster ages in both galaxies revealed a peak at 100 Myr, which may be connected with the last encounter of the LMC and the SMC. Chiosi et al. (2006) used isochrone fitting for 311 young clusters and report two enhancements of star formation, between 100−150 Myr and between 1 and 1.6 Gyr. They conclude that the last tidal interaction between the MCs has triggered the formation of both clusters and field stars. Moreover, Glatt et al. (2010) find two periods of enhanced cluster formation at 125 Myr and 800 Myr in the LMC and at 160 Myr and 630 Myr in the SMC. The cluster ages were determined by fitting Padova and Geneva isochrones.
Observing log.
The gradient in metallicity provides information on the chemical evolution of the two galaxies. A systematic radial metallicity trend is found in the cluster system of the LMC (Kontizas et al. 1993) from a sample of clusters up to 8 Kpc from the centre. The sudden rise in the SFR could explain the corresponding sudden rise in the metallicity possibly connected to a former close encounter with the Milky Way that took place ~1.5 Gyr ago. The metallicity and SFR connected to this event have been observed both from the metallicity in the clusters (Olszewski et al. 1996; Geisler et al. 1997) and from α-particle elements in planetary nebulae (Dopita 1997). Considering that a more recent encounter occurred 0.2 to 0.4 Gyr ago (Gardiner & Noguchi 1996; Kunkel et al. 2000), it is very interesting to see if these two events have left traces in the AMR. Dirsch et al. (2000) have determined the metallicity of six LMC populous clusters and their fields from Strömgren photometry. They propose that their AMR predicts a less steep increase in the metallicity in earlier time than found by Pagel & Tautvaisiene (1999). Piatti & Geisler (2013), who present age and metallicity estimates of 5.5 million stars distributed throughout the LMC, find evidence of AMR for the ages up to 1 Gyr, but no significant metallicity gradient between 5 and 12 Gyr.
In the SMC, Da Costa & Hatzidimitriou (1998) determined metallicities from spectra of red giants at the Ca II triplet. The resulting AMR is generally consistent with one for a simple model of chemical evolution, scaled to the present-day SMC mean abundance and gas mass fraction. Using the same method, Carrera et al. (2008) trace a metallicity gradient for the first time in the SMC. They also relate a spatial metallicity gradient to an age gradient, in the sense that more metal-rich stars, which are also younger, are concentrated in the central regions of the galaxy. Piatti (2011) presents age and metallicity estimates of 11 SMC clusters obtained from CCD Washington CT1T2 photometry. Two enhanced star formation periods are found at 2 Gyr and at 5−6 Gyr, which have taken place throughout the entire galaxy. However, they notice an absence of age metallicity gradient and a relative spread in metallicity for clusters older than 7 Gyr.
It therefore seems worthwhile to investigate the AMR for the MCs, especially for the youngest (up to 1 Gyr) clusters in the LMC and search for traces due to the most recent interactions. In Sect. 2 of this paper we describe the observational characteristics and data reduction, while in Sect. 3 we present the derived ages and metallicities and discuss our results. Our conclusions are given in Sect. 4.
2. Observations – reductions
The MCs possess a large population of stellar clusters for a whole range of ages. Small open LMC clusters offer homogeneous and ideal targets for this investigation. Their small central density allows us to derive cluster parameters with CCD Strömgren photometry and with small telescopes and reasonable integration times.
Four observing runs at La Silla in Chile were granted for this project. We observed the LMC clusters with the 1.54 m Danish Telescope, using the Danish Faint Object Spectrograph and Camera (DFOSC) with a single 2k × 2k CCD, which matched the RCA SIO 501 EX CCO (optimum final pixel size of 0 4). The full field covered by the instrument is . The ESO 3.6 m Telescope was used to observe the SMC with the ESO Faint Object Spectrograph and Camera (EFOSC). This CCD camera can be used as a very efficient instrument for the wideband photometry of crowded stellar fields. EFOSC size is 1024 × 1024 pixels, with a total field of view of and optimum final pixel size of 032. The observations took place in various intervals between December 1997 and December 2002 (Table 1).
We used the three Strömgren filters y,b,v to be able to find the faintest possible sources and search for the oldest small clusters in the LMC periphery. It was possible to use neither the u filter nor the β filters. The obtained frames have been reduced in the conventional way by DAOPHOT from both IRAF and MIDAS packages.
In the LMC, two frames were available in each colour, and used to obtain the average magnitudes for the Colour magnitude diagrams (CMDs) and m1 (vs.) b − y diagrams. The adopted difference in DAOPHOT mag within the two frames are shown in Fig. 1a for the cluster KMHK1399 in the V mag. A typical diagram of the standard error derived for the filter V of cluster KMHK1399 is shown in Fig. 1b. For most of the SMC clusters, three frames were used to derive the standard error for each filter. However in the cases of L80, NGC 330, and NGC 361 only one frame was available for each filter.
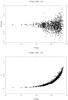 |
Fig. 1 Panel a) adopted difference in DAOPHOT mag within the two frames for the cluster KMHK1399 for the V colour. Panel b) adopted standard error for the cluster KMHK1399 in the V mag. |
An appropriate set of standard stars was obtained each night in order to achieve a reliable calibration. Transformations from the instrumental system to the standard system was obtained using the following equations (Richter et al. 1999):  The By, Bb, and Bv parameters are the atmospheric extinction coefficients for the y, b, and v filters. The Xy, Xb, and Xv parameters are the airmass at the three filters and they are known from the observations. The By, Bb, and Bv are also known, so they are kept constant in the equations, and they do not have any errors. Finally using least square fittings we estimate the remaining six parameters: Ay, Ab, Av, Cy, Cb, and Cv. The values of the transformation coefficients are shown in Table 2, which is available in electronic form.
The adopted criteria for the photometry to produce the CMDs are: a) During cross identification of stars on all available frames in all filters, only those stars with coordinates matching better than 1 pixel (0.4 arcsec/pixel for the LMC and 0.32 arcsec/pixel for the SMC) were accepted. b) Photometric error for y,b,v is found as the weighted average of the values found in the corresponding frames. We used these errors to determine the final errors in b − y and m1. c) The stars adopted for the production of the CMDs are only, those with error 0.1 mag in V, b − y, and m1. d) Using DAOPHOT we adopted x2 < 1.9 as goodness of the PSF fit, and image sharpness, s, | s | < 1.
3. Discussion
The present sample of clusters includes seven clusters (KMK1, KMK3, KMK8, HS153, KMK32, KMK49, and KMK50) located in the central region of LMC and eight clusters (KMHK81, KMHK1042, KMHK1278, KMHK1381, KMHK1399, KMHK1640, SL36, and SL620) located in the outer region of the LMC. From the outermost clusters, three are located in the north and five in the south with an average distance R ≤ 6 − 7 kpc from the centre. Generally, the young LMC clusters (a few × 108 yr) are only located in the central region, whereas all other older ones are found all over the LMC (Kontizas et al. 1990). The SMC clusters are mostly chosen to be on the outskirts of the galaxy to avoid crowded regions. The spatial distribution of the MC selected star clusters is shown in Fig. 2. They are overplotted on the catalogue of the MC star clusters of Bica et al. (2008).
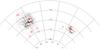 |
Fig. 2 Spatial distribution of the MCs star clusters under investigation. |
Strömgren photometry is known to be an excellent metallicity indicator for late type stars (Richtler 1988, 1989; Grebel & Richtler 1992). It is particularly efficient when performed with a CCD in dense star fields like the MCs. The validity domain for giants and red supergiants is 0.4 < b − y < 1.1 (Grebel & Richtler 1992; Hilker et al. 1995). On the Strömgren V, (b − y) CMD we fit the isochrone that best describes the stellar content of the cluster. From the isochrone we derive age and an estimation of metallicity. Then we search for red supergiants and compare them with red supergiants of the field. The ideal case is when we can find red supergiants of the cluster that do not appear in the field. Then we trace the position of these stars on the m1, (b − y) diagram and compare them with the model lines that indicate equal metallicity. Thus we provide the estimation of the Strömgren metallicity.
More details of the procedure are given in the following sections.
3.1. Ages of the clusters
For each cluster we produced a V,(b − y) CMD. To trace the cluster stars among the contaminated nearby and/or projected field stars, we carried out the following. A central region around each cluster centre was chosen to be both as small as possible (~0.75 arcmin radius), in order to include the largest proportion of cluster members, and large enough because sometimes crowding was too severe to have measurements of the very central stars. In the outer parts of the cluster we were able to find a region characterizing the nearby field stellar population. We selected such fields to have the same area as the cluster, and then produced the corresponding CMDs. Comparison of the two diagrams (central cluster & field respectively) may allow the determination of the cluster members. In case there is a significant difference in their CMDs, determining the cluster parameters, such as age and metallicity, is much more reliable than in cases where the two diagrams have small differences.
Then we fit the isochrone that best describes the stellar population of the cluster. The models used are those of Schaerer et al. (1993a,b), Schaller et al. (1992); Charbonnel et al. (1993), and Padova Isochrones (http://stev.oapd.inaf.it/cmd, CMD 2.3, Marigo et al. 2008; Girardi et al. 2010) with an appropriate transformation for the Strömgren magnitudes. The isochrones provide the parameters of age in Gyr and metallicity Z. The E(b − y) is determined by estimating how much one should move the isochrones to the red (right direction) to match the stars better.
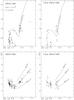 |
Fig. 3 CMD for the cluster KMHK1399 and its equal area field for r = 0.75 arcmin, along with the metallicity for the cluster KMHK1399 and its field. |
In Fig. 3 the CMDs of cluster KMHK1399 and its adjoining field are given as an example. In this figure the upper two diagrams show the V,(b − y) CMDs for the cluster and the field. In the upper left-hand diagram the isochrone that best describes the cluster population is overplotted. Figures 4 to 25 are only available in electronic form. They present the CMDs of the rest of the studied clusters and their adjoining fields. The derived values of the age, metallicity, and the extinction for each cluster are listed in Table 3, Cols. 2, 4, and 5, respectively. The metallicity values are transformed from Z to [Fe/H], using the transformation table by Durand et al. (1984).
3.2. Metallicities
A second set of diagrams for the cluster-field pairs was produced in order to derive the metallicity from the Strömgren magnitudes and the traditional diagram m1, (b − y). Hilker et al. (1995) have produced three lines of constant metallicity providing the determination of the metallicity with acceptable accuracy for the late type stars, with 0.4 < b − y < 1.1. The pairs of m1, (b − y) diagrams are shown in Figs. 3 to 25 (lower two diagrams) for the clusters and their adjoining fields. In the lower left-hand diagram the models for the Strömgren metallicity by Hilker et al. (1995) are overplotted.
Initially we have to trace the red supergiants of the cluster on the V,(b − y) CMD. We again have to compare with red supergiants of the field. For the clusters with old ages, there is a fair number of late type stars in the cluster that do not appear on the field CMDs. Following the red supergiants on m1, (b − y) we compare with the model lines that indicate equal metallicity. Thus we derive the metallicity value [Fe/H]. For some young clusters in our sample (KMK1, KMK3, and NGC 376), the red giants, if any, are few, and the cluster CMD is very similar to the field CMD, so the metallicity derived from m1, (b − y) is of low accuracy. We then adopted the metallicity derived from the isochrones. The errors in metallicity are calculated according to Hilker et al. (1995), and the mean error is estimated to 0.3. In Col. 2 of Table 3, we give the derived Strömgren metallicity for each cluster. The mean value of the differences between Strömgren metallicity and the metallicity derived from the isochrones is 0.45 which is comparable to the adopted mean error.
Derived ages and metallicities for 15 LMC and the 8 SMC star clusters.
Ages and metallicities for clusters found in the literature.
Most of the clusters under investigation have not been examined before. For the rest of them we present values of age and [Fe/H] found in the litterature in Table 4. Column 1 gives the name of the cluster, Cols. 2, 3 list the age and [Fe/H] respectively. The 4th column notes the reference article. Our results are in good agreement with those found in the litterature. Metallicity has been calculated before with Strömgren photometry only for NGC 330 (Hilker et al. 1995; Grebel & Richtler 1992). Our result (−1.0) is very close to their estimation.
3.3. Uncertainties
The errors in the metallicity estimations lie in three domains: a) the photometric errors due to data reduction; b) uncertainties introduced from the selection of cluster stars, considering the contamination of the field stars; and c) the spread of the data points around the model lines (isochrones and Strömgren metallicity models). However, we are able to calculate arithmetically only the photometric errors, and we have used only stars on the CMDs with error less than or equal to 0.1 mag. Uncertainties from the error domains b) and c) were visually estimated. The uncertainties of this kind can be important in the cases of three clusters: KMK1 and KMK3 for the LMC, and NGC 376 for the SMC. The positions of these LMC clusters on the AMR diagram are KMK1:(0.2,0.3) and KMK3:(0.1, 0.0). Thus removing them from the AMR diagram would change neither the trend nor the discussion. The results for KMK8, KMK1278, and KMK1381 are quite satisfactory concerning the amount of uncertainty, while the uncertainty is minimum for the rest of the clusters. The mean error for all the clusters is estimated as 0.4 and 0.3 for age and [Fe/H], respectively.
3.4. Results
After considering the previous remarks we now investigate the AMR found for the fifteen clusters of the MCs. Figure 26 shows a clear trend towards higher metallicities by the youngest LMC clusters. The accuracy of our data is within the errors described by Hilker et al. (1995).
Moreover, we notice a possible jump in metallicity and a considerable increase at the age of about 6 × 10⁸ yr. This can be connected to the latest LMC-SMC interaction, which has been calculated to have happened at 108 − 109 yr ago (Yoshizawa & Noguchi 2003) The AMR for the LMC is also displaying evidence of a gradient in metallicity with distance from the centre of the cluster, since clusters with metallicity −1.0 to −1.5 are mainly located in the outermost regions of the galaxy Fig. 2.
The SMC star clusters have low metallicities regardless their location in the galaxy. No clear gradient can be found in the AMR, but the sample is not statistically large enough to give reliable results.
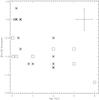 |
Fig. 26 Age-metallicity relation for LMC (asterisks) and SMC (squares) star clusters. The representative mean errors in age and [Fe/H] are 0.4 Gyr and 0.3, respectively. The corresponding error bars are plotted in the top right-hand corner. |
4. Conclusions
The age-metallicity relation is a very important tool for understanding the evolution of a galaxy. Enhancements of metallicity may represent higher star formation activity, while gaps can be associated with quiescent phases in the star formation history of a galaxy. The AMR for LMC and SMC is investigated in this paper. Moreover, possible indications for gradient of metallicity in the LMC and traces of the interaction between the two galaxies are examined. Taking into consideration the discussion of the errors, we can summarise the results from Fig. 26 as follows.
-
1.
The LMC displays a clear trend of AMR with highermetallicities found in the young clusters, a result expected in thenormal evolution of a galaxy’s stellar content. The SMC does notshow any such evidence, possibly because of the small sample weused or because of a different history of star formation in thisgalaxy.
-
2.
An observed jump in the LMC shows an increase in metallicity at ages of about 6 × 10⁸. This could be the result of the most recent encounter in the LMC-SMC that has produced intense star formation in the LMC.
-
3.
A clear metallicity gradient is observed in the LMC. The clusters with metallicities −1.0 to −1.5 are those found in the outer regions of the LMC. This is an indication that the recent star formation in the LMC occurs in the central regions.
-
4.
In the SMC there is no indication of an AMR relation; however, this investigation again displays the known result that the LMC is more metal rich than the SMC galaxy.
Online material
Transformation coefficients.
Acknowledgments
The authors would like to acknowledge the NATO grant, CRG.GRGP/972234, and the Greek General Secretariat of Research and Technology for financial support. B. Nordström and J. Andersen acknowledge support from the Danish Natural Research council (grants 10−084349, 09−062384) and the Carlsberg Foundation.
References
- Bica, E., Bonatto, C., Dutra, C. M., & Santos, J. F. C. 2008, MNRAS, 389, 678 [NASA ADS] [CrossRef] [Google Scholar]
- Carrera R.,Gallart, C., Aparicio, A., et al. 2008, AJ, 136, 1039 [NASA ADS] [CrossRef] [Google Scholar]
- Charbonnel, C., Meynet, G., Maeder, A., Schaller, G., & Schaerer, D. 1993, A&AS, 101 415 [Google Scholar]
- Chiosi, E., Vallenari, A., Held, E. V., Rizzi, L., & Moretti, A. 2006, A&A, 4525, 179 [NASA ADS] [CrossRef] [EDP Sciences] [Google Scholar]
- Clausen, J. V., Larsen, S. S., Garcia, J. M., Gimenez, A., & Storm, J. 1997, A&AS, 122, 559 [NASA ADS] [CrossRef] [EDP Sciences] [Google Scholar]
- da Costa, G. S. 1991, in The Magellanic Clouds, eds. R. Haynes, & D. Milne, IAU Symp., 148, 183 [Google Scholar]
- da Costa, G. S., & Hatzidimitriou, D. 1998, A&A, 115, 1934 [Google Scholar]
- Dirsch, B., Richtler, T., Gieren, W. P., & Hilker, M. 2000, A&A, 360, 133 [NASA ADS] [Google Scholar]
- Dopita, M. A., Vassiliadis, E., Wood, P. R., et al. 1997, ApJ, 474, 188 [NASA ADS] [CrossRef] [Google Scholar]
- Durand, D., Hardy, E., & Melnick, J. 1984, ApJ, 283, 552 [NASA ADS] [CrossRef] [Google Scholar]
- Elson, R. W., Gilmore, G. F., & Santiago, B. X. 1997, MNRAS, 289, 157 [NASA ADS] [CrossRef] [Google Scholar]
- Gardiner, L. T., & Noguchi, M. 1996, MNRAS, 278, 191 [NASA ADS] [CrossRef] [Google Scholar]
- Geha, M. C., Holtzman, J. A., Mould, J. R., et al. 1998, AJ, 115, 1045 [NASA ADS] [CrossRef] [Google Scholar]
- Geisler, D., Bica, E., Dottori, H., et al. 1997, AJ, 114, 1920 [NASA ADS] [CrossRef] [Google Scholar]
- Girardi, L., Williams, B. F., Gilbert, K. M., et al. 2010, ApJ, 724, 1030 [NASA ADS] [CrossRef] [Google Scholar]
- Glatt, K., Grebel, E. K., Sabbi, E., et al. 2008, AJ, 136, 1703 [NASA ADS] [CrossRef] [Google Scholar]
- Glatt, K., Grebel, E. K., & Koch, A. 2010, A&A, 517, A50 [NASA ADS] [CrossRef] [EDP Sciences] [Google Scholar]
- Grebel, E. K., & Richtler, T. 1992, A&A, 253, 359 [NASA ADS] [Google Scholar]
- Hilker, M., Richtler, T., & Gieren, W. 1995, A&A, 294, 648 [NASA ADS] [Google Scholar]
- Hodge, P. W. 1983, ApJ, 264, 470 [NASA ADS] [CrossRef] [Google Scholar]
- Kontizas, M. 1980, A&AS, 40, 151 [NASA ADS] [Google Scholar]
- Kontizas, E., Metaxa, M., & Kontizas, M. 1988, AJ, 96, 1625 [NASA ADS] [CrossRef] [Google Scholar]
- Kontizas, M., Morgan, D. H., Hatzidimitriou, D., et al. 1990, A&AS, 84, 527 [NASA ADS] [Google Scholar]
- Kontizas, M., Kontizas, E., & Michalitsianos, A. G. 1993, A&A, 269, 107 [NASA ADS] [Google Scholar]
- Kunkel, W. E., Demers, S., & Irwin, M. J. 2000, AJ, 119, 2789 [NASA ADS] [CrossRef] [Google Scholar]
- Maragoudaki, F., Kontizas, M., Kontizas, E., Dapergolas, A., & Morgan, D. H. 1998, A&A, 338, L29 [NASA ADS] [Google Scholar]
- Maragoudaki, F., Kontizas, M., Morgan, D. H., et al. 2001, A&A, 379, 864 [NASA ADS] [CrossRef] [EDP Sciences] [Google Scholar]
- Marigo, P., Girardi, L., Bressan, A., et al. 2008, A&A, 482, 883 [NASA ADS] [CrossRef] [EDP Sciences] [Google Scholar]
- Mighell, K. J., Sarajedini, A., & French, R. S. 1998, AJ, 116, 2395 [NASA ADS] [CrossRef] [Google Scholar]
- Olszewski, E. W., Suntzeff, N. B., & Mateo, M. 1996, ARA&A, 34, 511 [NASA ADS] [CrossRef] [Google Scholar]
- Pagel, B. E. J., & Tautvaisiene, G. 1999, Ap&SS, 265, 461 [NASA ADS] [CrossRef] [Google Scholar]
- Piatti, A. E. 2011, MNRAS, 418, L69 [NASA ADS] [Google Scholar]
- Piatti, A. E., & Geisler, D. 2013, AJ, 145, 17 [NASA ADS] [CrossRef] [Google Scholar]
- Piatti, A. E., Sarajedini, A., Geisler, D., Clark, D., & Seguel, J. 2007, MNRAS, 377, 300 [NASA ADS] [CrossRef] [Google Scholar]
- Pietrzynski, G., & Udalski, A. 2000, Acta Astron., 50, 355 [NASA ADS] [Google Scholar]
- Rich, R. M., Shara, M., Fall, S. M., & Zurek, D. 2000, AJ, 119, 197 [NASA ADS] [CrossRef] [Google Scholar]
- Richter, P., Hilker, M., & Richtler, T. 1999, A&A, 350, 476 [NASA ADS] [Google Scholar]
- Richtler, T. 1988, A&A, 204 101 [Google Scholar]
- Richtler, T. 1989, A&A, 211 199 [Google Scholar]
- Schaerer, D., Charbonnel, C., Meynet, G., et al. 1993a, A&AS, 102, 339 [NASA ADS] [Google Scholar]
- Schaerer, D., Meynet, G., Maeder, A., & Schaller, G. 1993b, A&AS, 98, 523 [NASA ADS] [Google Scholar]
- Schaller, G., Schaerer, D., Meynet, G., & Maeder, A. 1992, A&AS, 96, 269 [Google Scholar]
- Schommer, R. A. 1991, in The Magellanic Clouds, IAU Symp., 148, 171 [NASA ADS] [Google Scholar]
- van den Bergh, S. 1991, ApJ, 369, 1 [NASA ADS] [CrossRef] [Google Scholar]
- Yoshizawa, A., & Noguchi, M. 2003, MNRAS, 339, 1135 [NASA ADS] [CrossRef] [Google Scholar]
All Tables
All Figures
|
Fig. 1 Panel a) adopted difference in DAOPHOT mag within the two frames for the cluster KMHK1399 for the V colour. Panel b) adopted standard error for the cluster KMHK1399 in the V mag. |
| In the text | |
|
Fig. 2 Spatial distribution of the MCs star clusters under investigation. |
| In the text | |
|
Fig. 3 CMD for the cluster KMHK1399 and its equal area field for r = 0.75 arcmin, along with the metallicity for the cluster KMHK1399 and its field. |
| In the text | |
|
Fig. 26 Age-metallicity relation for LMC (asterisks) and SMC (squares) star clusters. The representative mean errors in age and [Fe/H] are 0.4 Gyr and 0.3, respectively. The corresponding error bars are plotted in the top right-hand corner. |
| In the text | |
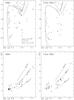 |
Fig. 4 Same as Fig. 3 for the cluster KMK1 and its adjoining field. |
| In the text | |
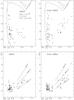 |
Fig. 5 Same as Fig. 3 for the cluster KMK3 and its adjoining field. |
| In the text | |
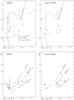 |
Fig. 6 Same as Fig. 3 for the cluster KMK8 and its adjoining field. |
| In the text | |
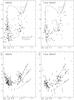 |
Fig. 7 Same as Fig. 3 for the cluster KMK32 and its adjoining field. |
| In the text | |
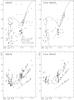 |
Fig. 8 Same as Fig. 3 for the cluster KMK49 and its adjoining field. |
| In the text | |
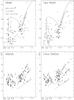 |
Fig. 9 Same as Fig. 3 for the cluster KMK50 and its adjoining field. |
| In the text | |
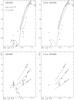 |
Fig. 10 Same as Fig. 3 for the cluster KMK81 and its adjoining field. |
| In the text | |
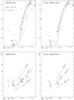 |
Fig. 11 Same as Fig. 3 for the cluster KMHK1042 and its adjoining field. |
| In the text | |
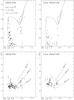 |
Fig. 12 Same as Fig. 3 for the cluster KMHK1278 and its adjoining field. |
| In the text | |
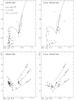 |
Fig. 13 Same as Fig. 3 for the cluster KMHK1381 and its adjoining field. |
| In the text | |
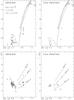 |
Fig. 14 Same as Fig. 3 for the cluster KMHK1640 and its adjoining field. |
| In the text | |
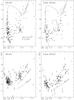 |
Fig. 15 Same as Fig. 3 for the cluster HS153 and its adjoining field. |
| In the text | |
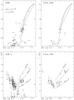 |
Fig. 16 Same as Fig. 3 for the cluster SL36 and its adjoining field. |
| In the text | |
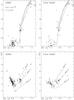 |
Fig. 17 Same as Fig. 3 for the cluster SL620 and its adjoining field. |
| In the text | |
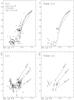 |
Fig. 18 Same as Fig. 3 for the cluster L11 and its adjoining field. |
| In the text | |
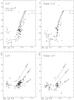 |
Fig. 19 Same as Fig. 3 for the cluster L17 and its adjoining field. |
| In the text | |
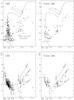 |
Fig. 20 Same as Fig. 3 for the cluster L80 and its adjoining field. |
| In the text | |
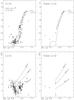 |
Fig. 21 Same as Fig. 3 for the cluster L113 and its adjoining field. |
| In the text | |
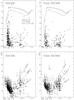 |
Fig. 22 Same as Fig. 3 for the cluster NGC 330 and its adjoining field. |
| In the text | |
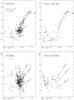 |
Fig. 23 Same as Fig. 3 for the cluster NGC 361 and its adjoining field. |
| In the text | |
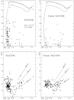 |
Fig. 24 Same as Fig. 3 for the cluster NGC 376 and its adjoining field. |
| In the text | |
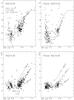 |
Fig. 25 Same as Fig. 3 for the cluster NGC 419 and its adjoining field. |
| In the text | |
Current usage metrics show cumulative count of Article Views (full-text article views including HTML views, PDF and ePub downloads, according to the available data) and Abstracts Views on Vision4Press platform.
Data correspond to usage on the plateform after 2015. The current usage metrics is available 48-96 hours after online publication and is updated daily on week days.
Initial download of the metrics may take a while.