Fig. 5
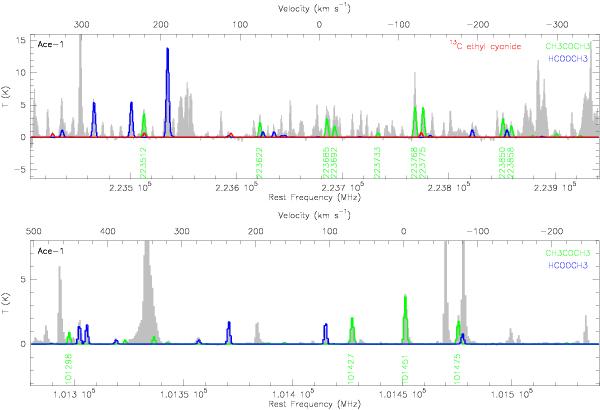
Comparison of the observed spectra (gray) and the synthesized acetone spectra (green) in LTE at 1.3 and 3 mm toward Ace-1. The observed spectra are plotted at their original synthesized beam sizes of  (101 GHz) and
  (223 GHz). The acetone synthesized spectra near 101 GHz (upper panel) were produced by assuming a (CH3)2CO column density of 3 × 1016 cm-2 and a temperature of 160 K, and the acetone synthesized spectra near 223 GHz (lower panel) were produced assuming a (CH3)2CO column density of 4 × 1016 cm-2 with the same temperature. Line widths of acetone synthesized spectra were fixed at 3.5 km s-1. As in Table 2, only the transitions with Eup < 300 K are indicated with their frequencies (in MHz), and the others are all blended. Synthesized 13C-substituted C2H5CN spectra are shown in red, assuming a column density of 2 × 1014 cm-2 and a temperature of 160 K. Their contributions to the acetone lines blending are minor. In addition, the methyl formate synthesized spectra (blue) are also shown for comparison.
Current usage metrics show cumulative count of Article Views (full-text article views including HTML views, PDF and ePub downloads, according to the available data) and Abstracts Views on Vision4Press platform.
Data correspond to usage on the plateform after 2015. The current usage metrics is available 48-96 hours after online publication and is updated daily on week days.
Initial download of the metrics may take a while.