Fig. 1
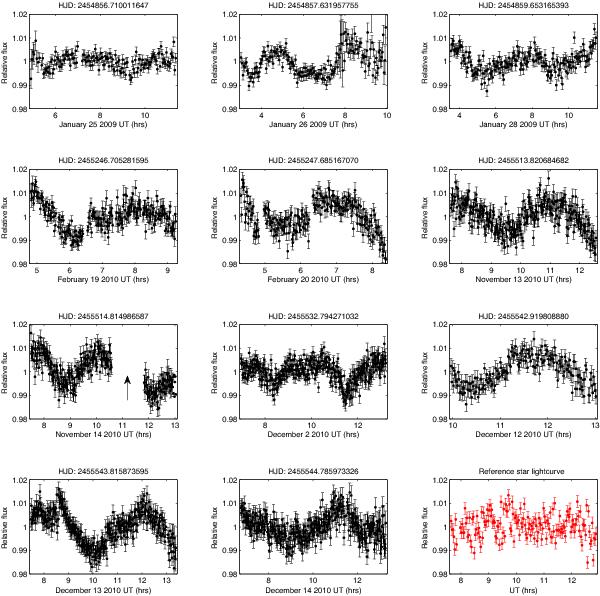
I-band light curves of 2MASS J0746+20AB. Each figure shows relative flux vs. UT times (and dates). We also mark the HJD time above each figure corresponding to the start-point of each observation. All of the data presented here was taken in the “VATT Arizona” I-band broadband filter (~7200–9100 Å), where the baseline extends over ~2 years – as shown in Table 1. In this work, we report the discovery of consistent periodic variability from 2MASS J0746+20A, with a period of 3.32 ± 0.15 h, and an amplitude variability range of 0.40–1.52%. We note that the full in-depth analysis investigating the stability of the target’s phase and amplitude is discussed in other work (Harding et al. 2013). Some poor weather conditions during constituent epochs were present – e.g. January 25 & 26, 2009 were taken under thin cloud and high wind conditions and thus were binned by a factor of 2 compared to other data sets (Table 1). The vertical arrow marked on the November 14 2010 light curve denotes a period of complete cloud cover, and so data was removed accordingly. The red light curve (bottom right) is an example of a reference star plotted against all others (taken from November 13 2010), illustrating the stability of the chosen reference stars with respect to the target. The mean amplitude variability of the reference stars is shown in Table 3.
Current usage metrics show cumulative count of Article Views (full-text article views including HTML views, PDF and ePub downloads, according to the available data) and Abstracts Views on Vision4Press platform.
Data correspond to usage on the plateform after 2015. The current usage metrics is available 48-96 hours after online publication and is updated daily on week days.
Initial download of the metrics may take a while.