Fig. 7
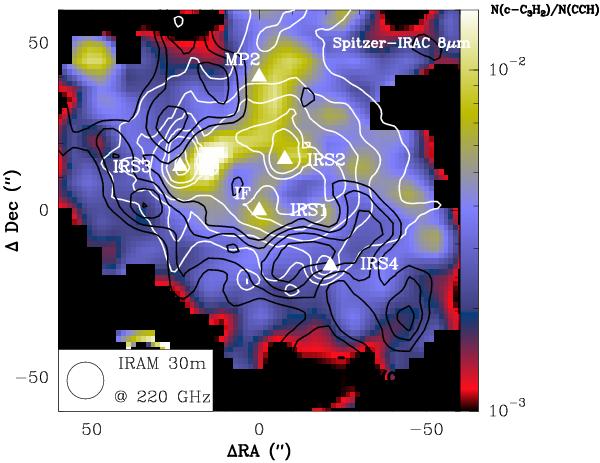
Color image shows the ratio of c-C3H2 to CCH column densities as derived from 1 mm observations, assuming the rotational temperature of Fig. 6. Pixels without a detection of both CCH and c-C3H2 have been masked. The black contours represent the integrated intensity of the 262.004 GHz CCH line (from 15 to 25 K km s-1 in steps of 2.5 K km s-1), and white contours represent the Spitzer IRAC 8 μm emission.
Current usage metrics show cumulative count of Article Views (full-text article views including HTML views, PDF and ePub downloads, according to the available data) and Abstracts Views on Vision4Press platform.
Data correspond to usage on the plateform after 2015. The current usage metrics is available 48-96 hours after online publication and is updated daily on week days.
Initial download of the metrics may take a while.