Fig. 6
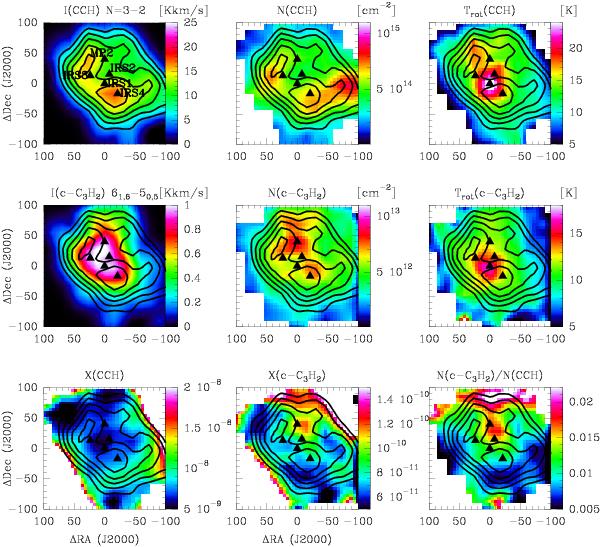
First two rows: maps of the integrated intensity of the CCH (262.004 GHz) and c-C3H2 (217.822 GHz) lines, and of the column density and rotation temperature derived by applying the rotational diagram technique to each pixel. Black contours indicate the CCH 3–2 integrated intensity, and go from 5 K km s-1 to 20 K km s-1 in linear steps of 2.5 K km s-1. The position of the infrared sources IRS1/2/3/4 (Henning et al. 1992) and the MP2 position (Ginard et al. 2012) are shown as black triangles. All the maps have been convolved to a spatial resolution of 29′′. Bottom row: CCH and c-C3H2 abundance maps, obtained using C18O as a reference and assuming 16O/18O = 500 and a CO abundance of 5 × 10⁻⁵ relative to H nuclei. The N(c-C3H2)/N(CCH) ratio is also shown.
Current usage metrics show cumulative count of Article Views (full-text article views including HTML views, PDF and ePub downloads, according to the available data) and Abstracts Views on Vision4Press platform.
Data correspond to usage on the plateform after 2015. The current usage metrics is available 48-96 hours after online publication and is updated daily on week days.
Initial download of the metrics may take a while.