Fig. 5
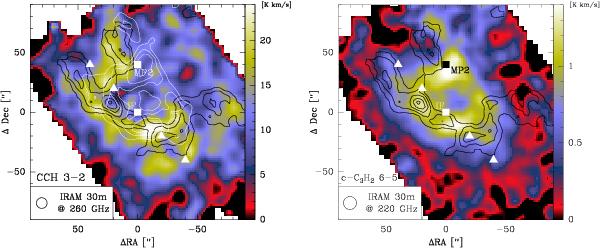
Maps of integrated intensity (in the range 5–15 km s-1) for CCH (262.004 GHz) and c-C3H2 (217.822 GHz) obtained with the EMIR receivers. Black contours are the C18O line shown in Fig. 1. White triangles and squares represent the single positions studied in this paper. White contours in the left panel represent the c-C3H2 line integrated intensities (in the range 5–15 km s-1) starting from 0.6 km s-1 and in linear steps of 0.2 km s-1.
Current usage metrics show cumulative count of Article Views (full-text article views including HTML views, PDF and ePub downloads, according to the available data) and Abstracts Views on Vision4Press platform.
Data correspond to usage on the plateform after 2015. The current usage metrics is available 48-96 hours after online publication and is updated daily on week days.
Initial download of the metrics may take a while.