Fig. 4
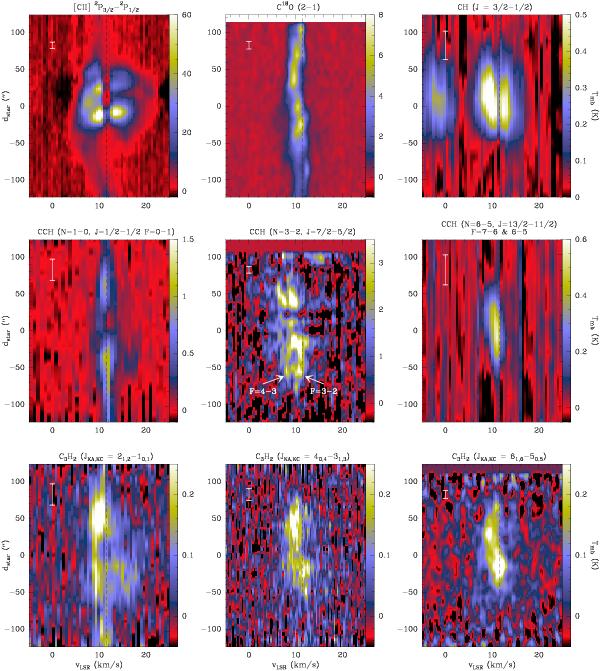
PV diagrams of the Herschel and IRAM observations along the SW-NE strip. The C ii diagrams comes from Pilleri et al. (2012a). The double-peaked structure of the CCH lines is due to two hyperfine components of the same line, while the strong dip in both CH and [C ii] are partially due to self-absorption. The white line in the top-right corner of each diagram represents the HPBW of the observation. The black dotted line indicates vLSR = 11.5 km s-1.
Current usage metrics show cumulative count of Article Views (full-text article views including HTML views, PDF and ePub downloads, according to the available data) and Abstracts Views on Vision4Press platform.
Data correspond to usage on the plateform after 2015. The current usage metrics is available 48-96 hours after online publication and is updated daily on week days.
Initial download of the metrics may take a while.