Fig. 1
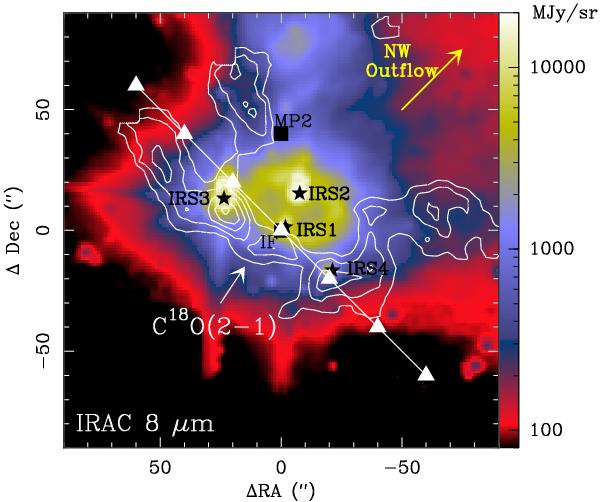
Overview of the region. The color image displays the IRAC 8 μm emission (Ginard et al. 2012), in which both the bright circular PDR and the extended northern PDR can be distinguished beneath the peaks due to the young stellar objects. The white contours represent the integrated intensity of the C18O (2→1) line between 5 and 15 km s-1 observed at the IRAM 30 m telescope (Pilleri et al. 2012a), with contour levels from 16 to 24 K km s-1 in linear steps of 2 K km s-1. The black squares represent the positions of the ionization front (IF) and the molecular peak (MP2), whereas the triangles and the white line indicate the positions observed with HIFI. The black stars indicate the position of the most intense infrared sources following the nomenclature of Henning et al. (1992). The yellow arrow indicates the direction of the NW molecular outflow (Tafalla et al. 1994).
Current usage metrics show cumulative count of Article Views (full-text article views including HTML views, PDF and ePub downloads, according to the available data) and Abstracts Views on Vision4Press platform.
Data correspond to usage on the plateform after 2015. The current usage metrics is available 48-96 hours after online publication and is updated daily on week days.
Initial download of the metrics may take a while.