Fig. 8
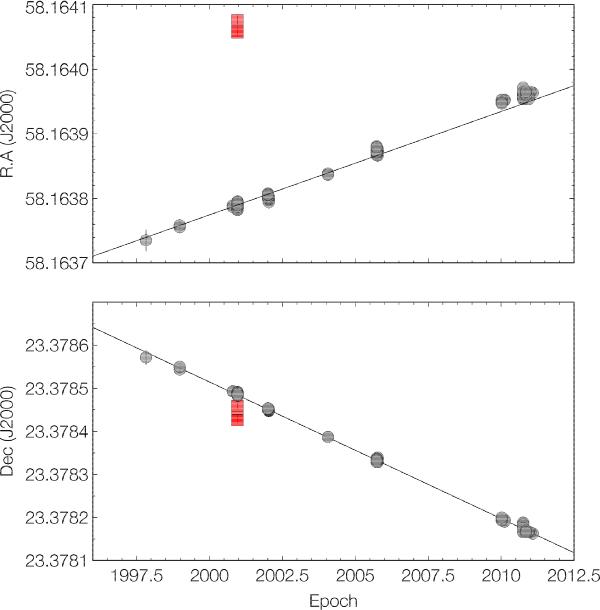
Example of proper motion fit in right ascension (upper panel) and declination (lower panel). Red squares correspond to measurements rejected by the outlier filtering procedure. For most measurements the uncertainties are smaller than the symbol. A total of 93 individual exposures (out of 96 in total) were used for this source. See also Fig. 20.
Current usage metrics show cumulative count of Article Views (full-text article views including HTML views, PDF and ePub downloads, according to the available data) and Abstracts Views on Vision4Press platform.
Data correspond to usage on the plateform after 2015. The current usage metrics is available 48-96 hours after online publication and is updated daily on week days.
Initial download of the metrics may take a while.