Fig. 13
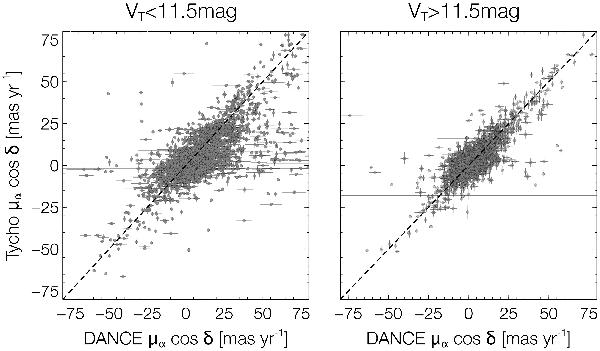
Proper motion in RA for the DANCe (x-axis) and Tycho (y-axis) catalogs. The error bars represent the estimated error for the DANCe measurements and the reported uncertainty in the case of the Tycho measurement. The left panel corresponds to sources with VT < 11.5 mag, the right panel to sources with VT > 11.5 mag. A dashed line corresponding to a linear relation is represented to guide the eye. A similar distribution is found in declination.
Current usage metrics show cumulative count of Article Views (full-text article views including HTML views, PDF and ePub downloads, according to the available data) and Abstracts Views on Vision4Press platform.
Data correspond to usage on the plateform after 2015. The current usage metrics is available 48-96 hours after online publication and is updated daily on week days.
Initial download of the metrics may take a while.