Free Access
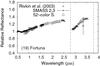
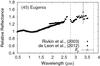
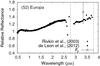
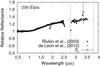
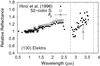
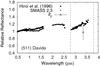
Fig. 6
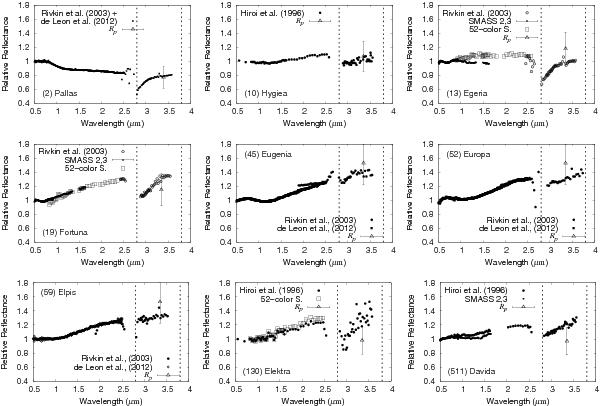
Assembled spectra of the control objects chosen to study the reflectivity at 3.4 μm derived from WISE data as a diagnostic of the presence of the 3-μm feature. The dashed lines approximately enclose the wavelength integration range of the W1 filter.
This figure is made of several images, please see below:
Current usage metrics show cumulative count of Article Views (full-text article views including HTML views, PDF and ePub downloads, according to the available data) and Abstracts Views on Vision4Press platform.
Data correspond to usage on the plateform after 2015. The current usage metrics is available 48-96 hours after online publication and is updated daily on week days.
Initial download of the metrics may take a while.