Free Access
Fig. 5
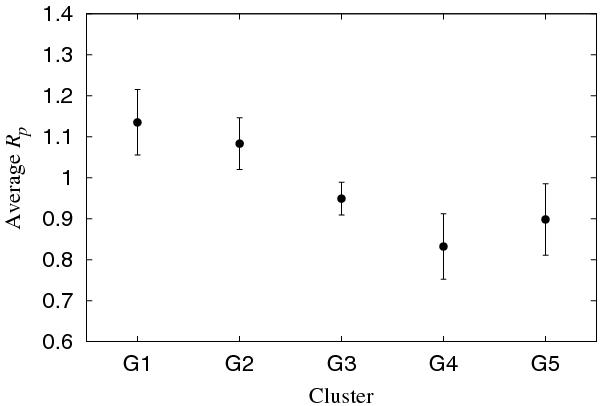
Average values of Rp for each cluster defined by de León et al. (2012). In terms of spectral slope up to 2.5 μm, cluster G5 is the bluest, whereas G1 is the reddest. The error bar is the standard error of the mean.
Current usage metrics show cumulative count of Article Views (full-text article views including HTML views, PDF and ePub downloads, according to the available data) and Abstracts Views on Vision4Press platform.
Data correspond to usage on the plateform after 2015. The current usage metrics is available 48-96 hours after online publication and is updated daily on week days.
Initial download of the metrics may take a while.