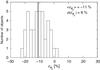
Fig. B.1
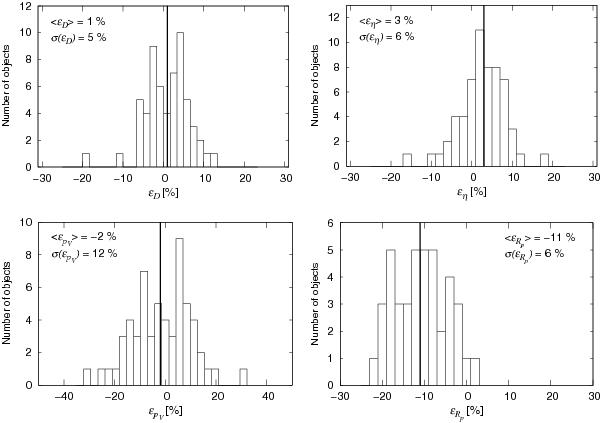
Fractional difference histograms of D, η, pV, and Rp. We define ε = 100(x − xM)/x, where x is the parameter value in this work and xM the correspoding value taken from Table 1 by Masiero et al. (2011). The vertical lines mark the corresponding average values. Only parameters resulting from the same input values of H contribute to these histograms.
Current usage metrics show cumulative count of Article Views (full-text article views including HTML views, PDF and ePub downloads, according to the available data) and Abstracts Views on Vision4Press platform.
Data correspond to usage on the plateform after 2015. The current usage metrics is available 48-96 hours after online publication and is updated daily on week days.
Initial download of the metrics may take a while.