Free Access
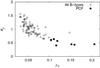
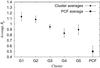
Fig. 11
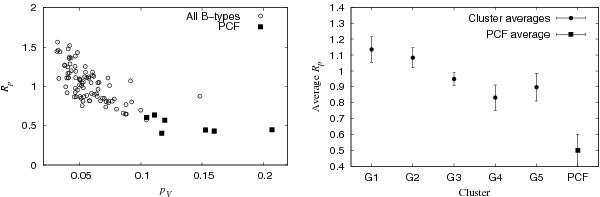
Left panel: PCF members are on average brighter in the visible and bluer in the 3.4 μm region than the B-types sample (cf. Fig. 3). The 20% error bars are not plotted for clarity. Right panel: the average Rp of the PCF continues the decreasing trend of the de León et al. (2012) clusters (cf. Fig. 5).
This figure is made of several images, please see below:
Current usage metrics show cumulative count of Article Views (full-text article views including HTML views, PDF and ePub downloads, according to the available data) and Abstracts Views on Vision4Press platform.
Data correspond to usage on the plateform after 2015. The current usage metrics is available 48-96 hours after online publication and is updated daily on week days.
Initial download of the metrics may take a while.