Fig. 2
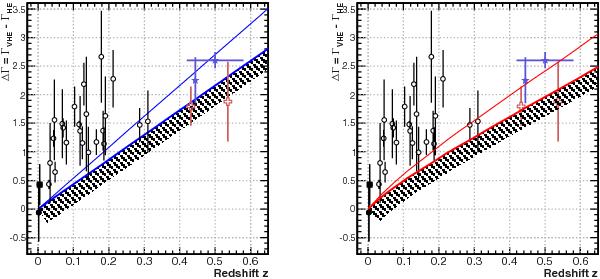
Value of ΔΓ as a function of the redshift z. Overlaid are the predicted breaks obtained from the Bayesian fit (simple line), as well as the 95% CL lower limits (hashed area). Left is the linear approximation (Eq. (1)) and right is the scaled model of Fra08 (Eq. (2)). For both models, none of the sources are significantly lower than the 95% CL lower limit. The symbols are descibed in Fig. 1.
Current usage metrics show cumulative count of Article Views (full-text article views including HTML views, PDF and ePub downloads, according to the available data) and Abstracts Views on Vision4Press platform.
Data correspond to usage on the plateform after 2015. The current usage metrics is available 48-96 hours after online publication and is updated daily on week days.
Initial download of the metrics may take a while.